- China
- /
- Electrical
- /
- SHSE:600241
Liaoning Shidai WanhengLtd's (SHSE:600241) Solid Earnings May Rest On Weak Foundations

The market shrugged off Liaoning Shidai Wanheng Co.,Ltd.'s (SHSE:600241) solid earnings report. Our analysis showed that there are some concerning factors in the earnings that investors may be cautious of.
Check out our latest analysis for Liaoning Shidai WanhengLtd
Examining Cashflow Against Liaoning Shidai WanhengLtd's Earnings
As finance nerds would already know, the accrual ratio from cashflow is a key measure for assessing how well a company's free cash flow (FCF) matches its profit. In plain english, this ratio subtracts FCF from net profit, and divides that number by the company's average operating assets over that period. You could think of the accrual ratio from cashflow as the 'non-FCF profit ratio'.
As a result, a negative accrual ratio is a positive for the company, and a positive accrual ratio is a negative. That is not intended to imply we should worry about a positive accrual ratio, but it's worth noting where the accrual ratio is rather high. To quote a 2014 paper by Lewellen and Resutek, "firms with higher accruals tend to be less profitable in the future".
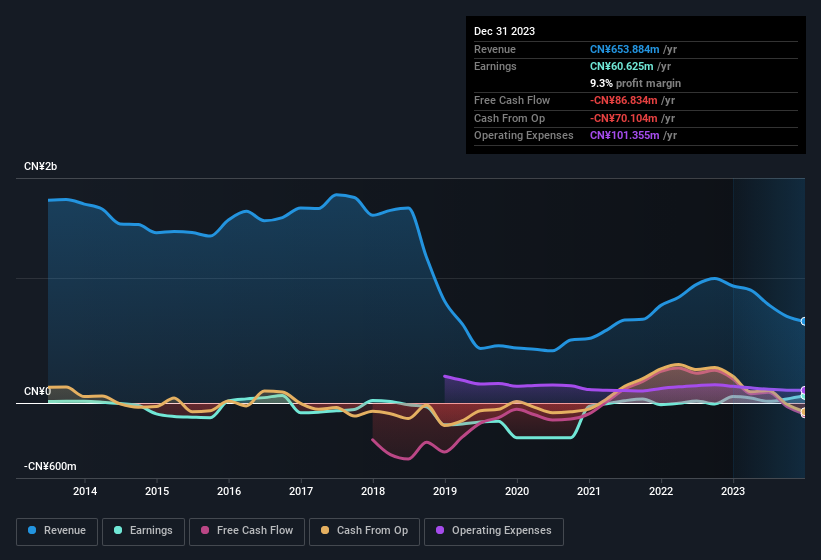
Liaoning Shidai WanhengLtd has an accrual ratio of 0.33 for the year to December 2023. We can therefore deduce that its free cash flow fell well short of covering its statutory profit, suggesting we might want to think twice before putting a lot of weight on the latter. Even though it reported a profit of CN¥60.6m, a look at free cash flow indicates it actually burnt through CN¥87m in the last year. It's worth noting that Liaoning Shidai WanhengLtd generated positive FCF of CN¥193m a year ago, so at least they've done it in the past. The good news for shareholders is that Liaoning Shidai WanhengLtd's accrual ratio was much better last year, so this year's poor reading might simply be a case of a short term mismatch between profit and FCF. As a result, some shareholders may be looking for stronger cash conversion in the current year.
Note: we always recommend investors check balance sheet strength. Click here to be taken to our balance sheet analysis of Liaoning Shidai WanhengLtd.
Our Take On Liaoning Shidai WanhengLtd's Profit Performance
As we discussed above, we think Liaoning Shidai WanhengLtd's earnings were not supported by free cash flow, which might concern some investors. As a result, we think it may well be the case that Liaoning Shidai WanhengLtd's underlying earnings power is lower than its statutory profit. The good news is that, its earnings per share increased by 24% in the last year. At the end of the day, it's essential to consider more than just the factors above, if you want to understand the company properly. So if you'd like to dive deeper into this stock, it's crucial to consider any risks it's facing. Case in point: We've spotted 2 warning signs for Liaoning Shidai WanhengLtd you should be mindful of and 1 of these is potentially serious.
Today we've zoomed in on a single data point to better understand the nature of Liaoning Shidai WanhengLtd's profit. But there are plenty of other ways to inform your opinion of a company. For example, many people consider a high return on equity as an indication of favorable business economics, while others like to 'follow the money' and search out stocks that insiders are buying. So you may wish to see this free collection of companies boasting high return on equity, or this list of stocks that insiders are buying.
New: AI Stock Screener & Alerts
Our new AI Stock Screener scans the market every day to uncover opportunities.
• Dividend Powerhouses (3%+ Yield)
• Undervalued Small Caps with Insider Buying
• High growth Tech and AI Companies
Or build your own from over 50 metrics.
Have feedback on this article? Concerned about the content? Get in touch with us directly. Alternatively, email editorial-team (at) simplywallst.com.
This article by Simply Wall St is general in nature. We provide commentary based on historical data and analyst forecasts only using an unbiased methodology and our articles are not intended to be financial advice. It does not constitute a recommendation to buy or sell any stock, and does not take account of your objectives, or your financial situation. We aim to bring you long-term focused analysis driven by fundamental data. Note that our analysis may not factor in the latest price-sensitive company announcements or qualitative material. Simply Wall St has no position in any stocks mentioned.
About SHSE:600241
Liaoning Shidai WanhengLtd
Engages in the research, development, production, and sale of energy batteries.
Flawless balance sheet with proven track record.
Market Insights

Community Narratives


