- China
- /
- Electrical
- /
- SHSE:600152
Veken Technology Co., Ltd.'s (SHSE:600152) 29% Dip In Price Shows Sentiment Is Matching Revenues


The Veken Technology Co., Ltd. (SHSE:600152) share price has fared very poorly over the last month, falling by a substantial 29%. The recent drop completes a disastrous twelve months for shareholders, who are sitting on a 56% loss during that time.
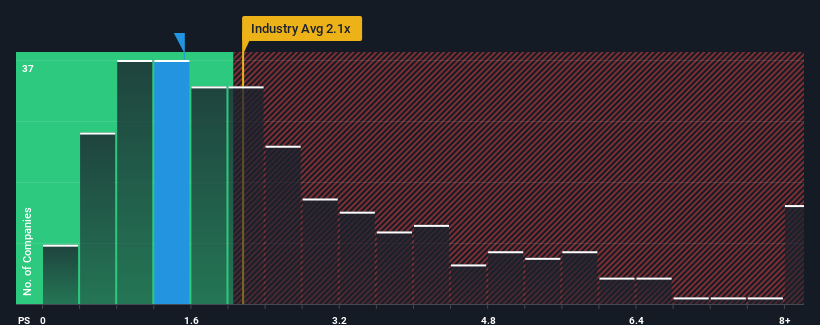
After such a large drop in price, given about half the companies operating in China's Electrical industry have price-to-sales ratios (or "P/S") above 2.1x, you may consider Veken Technology as an attractive investment with its 1.5x P/S ratio. Although, it's not wise to just take the P/S at face value as there may be an explanation why it's limited.
View our latest analysis for Veken Technology
How Veken Technology Has Been Performing
As an illustration, revenue has deteriorated at Veken Technology over the last year, which is not ideal at all. Perhaps the market believes the recent revenue performance isn't good enough to keep up the industry, causing the P/S ratio to suffer. Those who are bullish on Veken Technology will be hoping that this isn't the case so that they can pick up the stock at a lower valuation.
Want the full picture on earnings, revenue and cash flow for the company? Then our free report on Veken Technology will help you shine a light on its historical performance.What Are Revenue Growth Metrics Telling Us About The Low P/S?
There's an inherent assumption that a company should underperform the industry for P/S ratios like Veken Technology's to be considered reasonable.
In reviewing the last year of financials, we were disheartened to see the company's revenues fell to the tune of 28%. This means it has also seen a slide in revenue over the longer-term as revenue is down 4.2% in total over the last three years. Therefore, it's fair to say the revenue growth recently has been undesirable for the company.
Comparing that to the industry, which is predicted to deliver 23% growth in the next 12 months, the company's downward momentum based on recent medium-term revenue results is a sobering picture.
With this in mind, we understand why Veken Technology's P/S is lower than most of its industry peers. Nonetheless, there's no guarantee the P/S has reached a floor yet with revenue going in reverse. Even just maintaining these prices could be difficult to achieve as recent revenue trends are already weighing down the shares.
What Does Veken Technology's P/S Mean For Investors?
The southerly movements of Veken Technology's shares means its P/S is now sitting at a pretty low level. Typically, we'd caution against reading too much into price-to-sales ratios when settling on investment decisions, though it can reveal plenty about what other market participants think about the company.
As we suspected, our examination of Veken Technology revealed its shrinking revenue over the medium-term is contributing to its low P/S, given the industry is set to grow. Right now shareholders are accepting the low P/S as they concede future revenue probably won't provide any pleasant surprises either. If recent medium-term revenue trends continue, it's hard to see the share price moving strongly in either direction in the near future under these circumstances.
It's always necessary to consider the ever-present spectre of investment risk. We've identified 2 warning signs with Veken Technology (at least 1 which is significant), and understanding them should be part of your investment process.
If these risks are making you reconsider your opinion on Veken Technology, explore our interactive list of high quality stocks to get an idea of what else is out there.
If you're looking to trade Veken Technology, open an account with the lowest-cost platform trusted by professionals, Interactive Brokers.
With clients in over 200 countries and territories, and access to 160 markets, IBKR lets you trade stocks, options, futures, forex, bonds and funds from a single integrated account.
Enjoy no hidden fees, no account minimums, and FX conversion rates as low as 0.03%, far better than what most brokers offer.
Sponsored ContentNew: Manage All Your Stock Portfolios in One Place
We've created the ultimate portfolio companion for stock investors, and it's free.
• Connect an unlimited number of Portfolios and see your total in one currency
• Be alerted to new Warning Signs or Risks via email or mobile
• Track the Fair Value of your stocks
Have feedback on this article? Concerned about the content? Get in touch with us directly. Alternatively, email editorial-team (at) simplywallst.com.
This article by Simply Wall St is general in nature. We provide commentary based on historical data and analyst forecasts only using an unbiased methodology and our articles are not intended to be financial advice. It does not constitute a recommendation to buy or sell any stock, and does not take account of your objectives, or your financial situation. We aim to bring you long-term focused analysis driven by fundamental data. Note that our analysis may not factor in the latest price-sensitive company announcements or qualitative material. Simply Wall St has no position in any stocks mentioned.
About SHSE:600152
Veken Technology
Engages in the research and development, manufacture, and sale of lithium batteries.
Flawless balance sheet and slightly overvalued.
Market Insights

Community Narratives


