- China
- /
- Construction
- /
- SHSE:600039
Sichuan Road & Bridge GroupLtd (SHSE:600039) Has A Somewhat Strained Balance Sheet


Some say volatility, rather than debt, is the best way to think about risk as an investor, but Warren Buffett famously said that 'Volatility is far from synonymous with risk.' When we think about how risky a company is, we always like to look at its use of debt, since debt overload can lead to ruin. We can see that Sichuan Road & Bridge Group Co.,Ltd (SHSE:600039) does use debt in its business. But is this debt a concern to shareholders?
When Is Debt A Problem?
Debt assists a business until the business has trouble paying it off, either with new capital or with free cash flow. If things get really bad, the lenders can take control of the business. While that is not too common, we often do see indebted companies permanently diluting shareholders because lenders force them to raise capital at a distressed price. Of course, the upside of debt is that it often represents cheap capital, especially when it replaces dilution in a company with the ability to reinvest at high rates of return. The first thing to do when considering how much debt a business uses is to look at its cash and debt together.
View our latest analysis for Sichuan Road & Bridge GroupLtd
How Much Debt Does Sichuan Road & Bridge GroupLtd Carry?
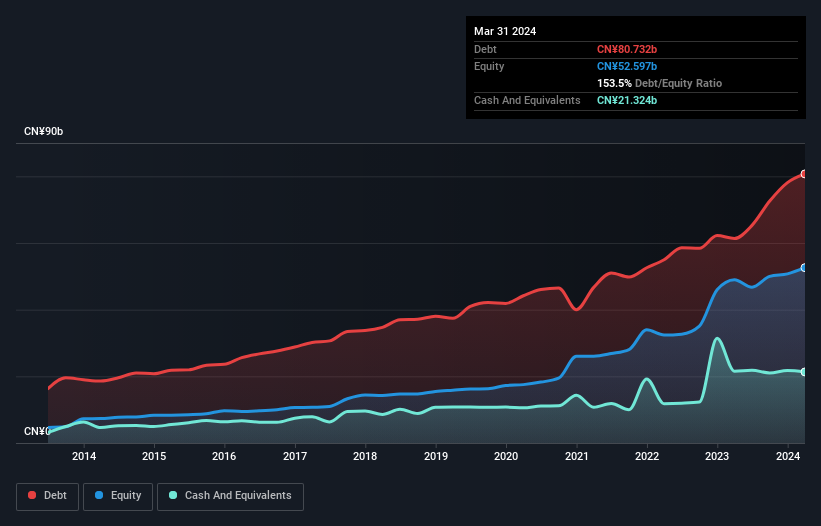
The image below, which you can click on for greater detail, shows that at March 2024 Sichuan Road & Bridge GroupLtd had debt of CN¥80.7b, up from CN¥61.3b in one year. However, it also had CN¥21.3b in cash, and so its net debt is CN¥59.4b.
How Strong Is Sichuan Road & Bridge GroupLtd's Balance Sheet?
The latest balance sheet data shows that Sichuan Road & Bridge GroupLtd had liabilities of CN¥113.6b due within a year, and liabilities of CN¥71.0b falling due after that. Offsetting these obligations, it had cash of CN¥21.3b as well as receivables valued at CN¥95.6b due within 12 months. So its liabilities outweigh the sum of its cash and (near-term) receivables by CN¥67.6b.
When you consider that this deficiency exceeds the company's CN¥67.2b market capitalization, you might well be inclined to review the balance sheet intently. In the scenario where the company had to clean up its balance sheet quickly, it seems likely shareholders would suffer extensive dilution.
We use two main ratios to inform us about debt levels relative to earnings. The first is net debt divided by earnings before interest, tax, depreciation, and amortization (EBITDA), while the second is how many times its earnings before interest and tax (EBIT) covers its interest expense (or its interest cover, for short). This way, we consider both the absolute quantum of the debt, as well as the interest rates paid on it.
Sichuan Road & Bridge GroupLtd has a debt to EBITDA ratio of 3.9 and its EBIT covered its interest expense 5.0 times. This suggests that while the debt levels are significant, we'd stop short of calling them problematic. Shareholders should be aware that Sichuan Road & Bridge GroupLtd's EBIT was down 24% last year. If that decline continues then paying off debt will be harder than selling foie gras at a vegan convention. There's no doubt that we learn most about debt from the balance sheet. But it is future earnings, more than anything, that will determine Sichuan Road & Bridge GroupLtd's ability to maintain a healthy balance sheet going forward. So if you're focused on the future you can check out this free report showing analyst profit forecasts.
Finally, a company can only pay off debt with cold hard cash, not accounting profits. So the logical step is to look at the proportion of that EBIT that is matched by actual free cash flow. Over the last three years, Sichuan Road & Bridge GroupLtd recorded negative free cash flow, in total. Debt is far more risky for companies with unreliable free cash flow, so shareholders should be hoping that the past expenditure will produce free cash flow in the future.
Our View
On the face of it, Sichuan Road & Bridge GroupLtd's conversion of EBIT to free cash flow left us tentative about the stock, and its EBIT growth rate was no more enticing than the one empty restaurant on the busiest night of the year. Having said that, its ability to cover its interest expense with its EBIT isn't such a worry. After considering the datapoints discussed, we think Sichuan Road & Bridge GroupLtd has too much debt. While some investors love that sort of risky play, it's certainly not our cup of tea. The balance sheet is clearly the area to focus on when you are analysing debt. However, not all investment risk resides within the balance sheet - far from it. We've identified 2 warning signs with Sichuan Road & Bridge GroupLtd (at least 1 which is a bit unpleasant) , and understanding them should be part of your investment process.
When all is said and done, sometimes its easier to focus on companies that don't even need debt. Readers can access a list of growth stocks with zero net debt 100% free, right now.
If you're looking to trade Sichuan Road & Bridge GroupLtd, open an account with the lowest-cost platform trusted by professionals, Interactive Brokers.
With clients in over 200 countries and territories, and access to 160 markets, IBKR lets you trade stocks, options, futures, forex, bonds and funds from a single integrated account.
Enjoy no hidden fees, no account minimums, and FX conversion rates as low as 0.03%, far better than what most brokers offer.
Sponsored ContentNew: Manage All Your Stock Portfolios in One Place
We've created the ultimate portfolio companion for stock investors, and it's free.
• Connect an unlimited number of Portfolios and see your total in one currency
• Be alerted to new Warning Signs or Risks via email or mobile
• Track the Fair Value of your stocks
Have feedback on this article? Concerned about the content? Get in touch with us directly. Alternatively, email editorial-team (at) simplywallst.com.
This article by Simply Wall St is general in nature. We provide commentary based on historical data and analyst forecasts only using an unbiased methodology and our articles are not intended to be financial advice. It does not constitute a recommendation to buy or sell any stock, and does not take account of your objectives, or your financial situation. We aim to bring you long-term focused analysis driven by fundamental data. Note that our analysis may not factor in the latest price-sensitive company announcements or qualitative material. Simply Wall St has no position in any stocks mentioned.
About SHSE:600039
Sichuan Road & Bridge GroupLtd
Engages in the investment, development, construction, and operation of engineering construction, mining, clean energy, and new materials in China and internationally.
Adequate balance sheet average dividend payer.
Market Insights

Community Narratives


