
Advertisement
Haima Automobile Co.,Ltd (SZSE:000572) Stock Rockets 26% As Investors Are Less Pessimistic Than Expected
Haima Automobile Co.,Ltd (SZSE:000572) shareholders are no doubt pleased to see that the share price has bounced 26% in the last month, although it is still struggling to make up recently lost ground. Not all shareholders will be feeling jubilant, since the share price is still down a very disappointing 24% in the last twelve months.
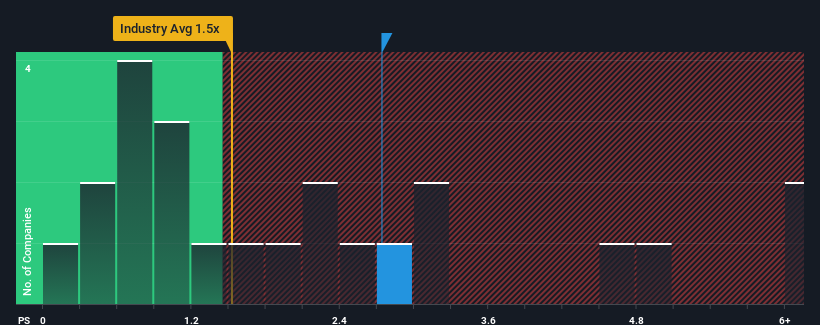
Since its price has surged higher, given close to half the companies operating in China's Auto industry have price-to-sales ratios (or "P/S") below 1.5x, you may consider Haima AutomobileLtd as a stock to potentially avoid with its 2.7x P/S ratio. However, the P/S might be high for a reason and it requires further investigation to determine if it's justified.
Check out our latest analysis for Haima AutomobileLtd
What Does Haima AutomobileLtd's P/S Mean For Shareholders?
The revenue growth achieved at Haima AutomobileLtd over the last year would be more than acceptable for most companies. It might be that many expect the respectable revenue performance to beat most other companies over the coming period, which has increased investors’ willingness to pay up for the stock. If not, then existing shareholders may be a little nervous about the viability of the share price.
We don't have analyst forecasts, but you can see how recent trends are setting up the company for the future by checking out our free report on Haima AutomobileLtd's earnings, revenue and cash flow.How Is Haima AutomobileLtd's Revenue Growth Trending?
In order to justify its P/S ratio, Haima AutomobileLtd would need to produce impressive growth in excess of the industry.
Retrospectively, the last year delivered a decent 9.2% gain to the company's revenues. The solid recent performance means it was also able to grow revenue by 14% in total over the last three years. So we can start by confirming that the company has actually done a good job of growing revenue over that time.
Comparing the recent medium-term revenue trends against the industry's one-year growth forecast of 66% shows it's noticeably less attractive.
With this in mind, we find it worrying that Haima AutomobileLtd's P/S exceeds that of its industry peers. Apparently many investors in the company are way more bullish than recent times would indicate and aren't willing to let go of their stock at any price. There's a good chance existing shareholders are setting themselves up for future disappointment if the P/S falls to levels more in line with recent growth rates.
What Does Haima AutomobileLtd's P/S Mean For Investors?
Haima AutomobileLtd's P/S is on the rise since its shares have risen strongly. While the price-to-sales ratio shouldn't be the defining factor in whether you buy a stock or not, it's quite a capable barometer of revenue expectations.
Our examination of Haima AutomobileLtd revealed its poor three-year revenue trends aren't detracting from the P/S as much as we though, given they look worse than current industry expectations. When we see slower than industry revenue growth but an elevated P/S, there's considerable risk of the share price declining, sending the P/S lower. Unless there is a significant improvement in the company's medium-term performance, it will be difficult to prevent the P/S ratio from declining to a more reasonable level.
We don't want to rain on the parade too much, but we did also find 1 warning sign for Haima AutomobileLtd that you need to be mindful of.
Of course, profitable companies with a history of great earnings growth are generally safer bets. So you may wish to see this free collection of other companies that have reasonable P/E ratios and have grown earnings strongly.
Valuation is complex, but we're here to simplify it.
Discover if Haima AutomobileLtd might be undervalued or overvalued with our detailed analysis, featuring fair value estimates, potential risks, dividends, insider trades, and its financial condition.
Access Free AnalysisHave feedback on this article? Concerned about the content? Get in touch with us directly. Alternatively, email editorial-team (at) simplywallst.com.
This article by Simply Wall St is general in nature. We provide commentary based on historical data and analyst forecasts only using an unbiased methodology and our articles are not intended to be financial advice. It does not constitute a recommendation to buy or sell any stock, and does not take account of your objectives, or your financial situation. We aim to bring you long-term focused analysis driven by fundamental data. Note that our analysis may not factor in the latest price-sensitive company announcements or qualitative material. Simply Wall St has no position in any stocks mentioned.
About SZSE:000572
Haima AutomobileLtd
Engages in the research, development, manufacture, sale, and financial service of automobiles and powertrains in China and internationally.
Adequate balance sheet with very low risk.
Market Insights

Advertisement
Weekly Picks
RO


RockeTeller on Santacruz Silver Mining ·
Crazy Undervalued 42 Baggers Silver Play (Active & Running Mine)
Fair Value:CA$8696.7% undervalued
59 followersusers have followed this narrative
7 commentsusers have commented on this narrative
17 likesusers have liked this narrative
RO


Robbo on Fiducian Group ·
Fiducian: Compliance Clouds or Value Opportunity?
Fair Value:AU$122.0% undervalued
9 followersusers have followed this narrative
0 commentsusers have commented on this narrative
0 likesusers have liked this narrative
WO

woodworthfund on Willamette Valley Vineyards ·
Willamette Valley Vineyards (WVVI): Not-So-Great Value
Fair Value:US$242.5% overvalued
10 followersusers have followed this narrative
0 commentsusers have commented on this narrative
1 likeusers have liked this narrative
Recently Updated Narratives
WO

woodworthfund on MGP Ingredients ·
THE KINGDOM OF BROWN GOODS: WHY MGPI IS BEING CRUSHED BY INVENTORY & PRIMED FOR RESURRECTION
Fair Value:US$4035.8% undervalued
2 followersusers have followed this narrative
0 commentsusers have commented on this narrative
0 likesusers have liked this narrative
DA


davidlsander on Beam Therapeutics ·
The "Molecular Pencil": Why Beam's Technology is Built to Win
Fair Value:US$15081.9% undervalued
50 followersusers have followed this narrative
3 commentsusers have commented on this narrative
1 likeusers have liked this narrative
MO


mo7md on ADNOC Gas ·
ADNOC Gas future shines with a 21.4% revenue surge
Fair Value:د.إ3.728.9% undervalued
3 followersusers have followed this narrative
0 commentsusers have commented on this narrative
0 likesusers have liked this narrative
Popular Narratives
TH


TheWallstreetKing on MicroVision ·
MicroVision will explode future revenue by 380.37% with a vision towards success
Fair Value:US$6098.5% undervalued
117 followersusers have followed this narrative
11 commentsusers have commented on this narrative
22 likesusers have liked this narrative
AN


AnalystConsensusTarget on NVIDIA ·
NVDA: Expanding AI Demand Will Drive Major Data Center Investments Through 2026
Fair Value:US$250.3927.2% undervalued
959 followersusers have followed this narrative
6 commentsusers have commented on this narrative
25 likesusers have liked this narrative
RO
RockeTeller on Santacruz Silver Mining ·
Crazy Undervalued 42 Baggers Silver Play (Active & Running Mine)
Fair Value:CA$8696.7% undervalued
59 followersusers have followed this narrative
7 commentsusers have commented on this narrative
17 likesusers have liked this narrative
