
Advertisement
- China
- /
- Auto Components
- /
- SHSE:688612
Subdued Growth No Barrier To Shenzhen VMAX New Energy Co., Ltd. (SHSE:688612) With Shares Advancing 30%
Those holding Shenzhen VMAX New Energy Co., Ltd. (SHSE:688612) shares would be relieved that the share price has rebounded 30% in the last thirty days, but it needs to keep going to repair the recent damage it has caused to investor portfolios. While recent buyers may be laughing, long-term holders might not be as pleased since the recent gain only brings the stock back to where it started a year ago.
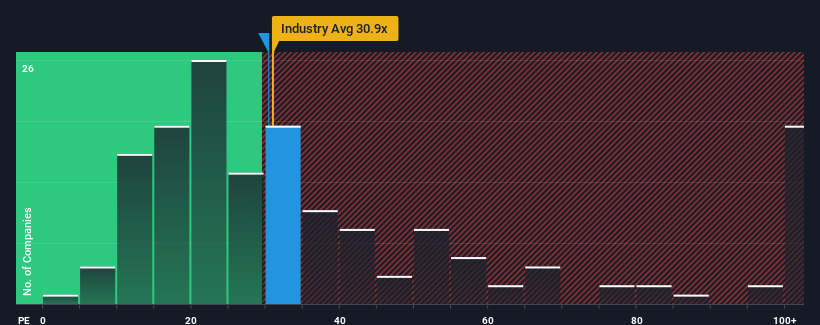
Even after such a large jump in price, it's still not a stretch to say that Shenzhen VMAX New Energy's price-to-earnings (or "P/E") ratio of 30.4x right now seems quite "middle-of-the-road" compared to the market in China, where the median P/E ratio is around 30x. However, investors might be overlooking a clear opportunity or potential setback if there is no rational basis for the P/E.
With its earnings growth in positive territory compared to the declining earnings of most other companies, Shenzhen VMAX New Energy has been doing quite well of late. One possibility is that the P/E is moderate because investors think the company's earnings will be less resilient moving forward. If you like the company, you'd be hoping this isn't the case so that you could potentially pick up some stock while it's not quite in favour.
View our latest analysis for Shenzhen VMAX New Energy
How Is Shenzhen VMAX New Energy's Growth Trending?
The only time you'd be comfortable seeing a P/E like Shenzhen VMAX New Energy's is when the company's growth is tracking the market closely.
If we review the last year of earnings growth, the company posted a terrific increase of 62%. Pleasingly, EPS has also lifted 5,846% in aggregate from three years ago, thanks to the last 12 months of growth. Accordingly, shareholders would have probably welcomed those medium-term rates of earnings growth.
Looking ahead now, EPS is anticipated to climb by 29% during the coming year according to the four analysts following the company. With the market predicted to deliver 41% growth , the company is positioned for a weaker earnings result.
With this information, we find it interesting that Shenzhen VMAX New Energy is trading at a fairly similar P/E to the market. Apparently many investors in the company are less bearish than analysts indicate and aren't willing to let go of their stock right now. These shareholders may be setting themselves up for future disappointment if the P/E falls to levels more in line with the growth outlook.
The Key Takeaway
Its shares have lifted substantially and now Shenzhen VMAX New Energy's P/E is also back up to the market median. It's argued the price-to-earnings ratio is an inferior measure of value within certain industries, but it can be a powerful business sentiment indicator.
We've established that Shenzhen VMAX New Energy currently trades on a higher than expected P/E since its forecast growth is lower than the wider market. When we see a weak earnings outlook with slower than market growth, we suspect the share price is at risk of declining, sending the moderate P/E lower. This places shareholders' investments at risk and potential investors in danger of paying an unnecessary premium.
Many other vital risk factors can be found on the company's balance sheet. Take a look at our free balance sheet analysis for Shenzhen VMAX New Energy with six simple checks on some of these key factors.
Of course, you might also be able to find a better stock than Shenzhen VMAX New Energy. So you may wish to see this free collection of other companies that have reasonable P/E ratios and have grown earnings strongly.
New: Manage All Your Stock Portfolios in One Place
We've created the ultimate portfolio companion for stock investors, and it's free.
• Connect an unlimited number of Portfolios and see your total in one currency
• Be alerted to new Warning Signs or Risks via email or mobile
• Track the Fair Value of your stocks
Have feedback on this article? Concerned about the content? Get in touch with us directly. Alternatively, email editorial-team (at) simplywallst.com.
This article by Simply Wall St is general in nature. We provide commentary based on historical data and analyst forecasts only using an unbiased methodology and our articles are not intended to be financial advice. It does not constitute a recommendation to buy or sell any stock, and does not take account of your objectives, or your financial situation. We aim to bring you long-term focused analysis driven by fundamental data. Note that our analysis may not factor in the latest price-sensitive company announcements or qualitative material. Simply Wall St has no position in any stocks mentioned.
About SHSE:688612
Shenzhen VMAX New Energy
Engages in the research, development, production, and sale and technical services of new energy vehicle power products in China and internationally.
Exceptional growth potential with flawless balance sheet.
Market Insights

Advertisement
Community Narratives
MicroVision will explode future revenue by 380.37% with a vision towards success
Fair Value US$60|98.4% undervalued
TH
Community Contributor
The Indispensable Artery for a New North American Economy
Fair Value CA$132.87|0.7% overvalued
TI
Community Contributor
Recently Updated Narratives
CO

composite32 on Astor Enerji ·
Astor Enerji will surge with a fair value of $140.43 in the next 3 years
Fair Value:₺140.4335.5% undervalued
1 followerusers have followed this narrative
0 commentsusers have commented on this narrative
0 likesusers have liked this narrative
RE

RecMag on Proximus ·
Proximus: The State-Backed Backup Plan with 7% Gross Yield and 15% Currency Upside.
Fair Value:€17.1356.7% undervalued
29 followersusers have followed this narrative
0 commentsusers have commented on this narrative
0 likesusers have liked this narrative
AG


Agricola on IMPACT Silver ·
A case for for IMPACT Silver Corp (TSXV:IPT) to reach USD $4.52 (CAD $6.16) in 2026 (23 bagger in 1 year) and USD $5.76 (CAD $7.89) by 2030
Fair Value:CA$7.8996.2% undervalued
1 followerusers have followed this narrative
0 commentsusers have commented on this narrative
0 likesusers have liked this narrative
Popular Narratives
TH

TheWallstreetKing on MicroVision ·
MicroVision will explode future revenue by 380.37% with a vision towards success
Fair Value:US$6098.4% undervalued
101 followersusers have followed this narrative
10 commentsusers have commented on this narrative
20 likesusers have liked this narrative
OS


oscargarcia on Alphabet ·
The company that turned a verb into a global necessity and basically runs the modern internet, digital ads, smartphones, maps, and AI.
Fair Value:US$3405.8% undervalued
137 followersusers have followed this narrative
6 commentsusers have commented on this narrative
18 likesusers have liked this narrative
AN


AnalystConsensusTarget on NVIDIA ·
NVDA: Expanding AI Demand Will Drive Major Data Center Investments Through 2026
Fair Value:US$250.3929.3% undervalued
929 followersusers have followed this narrative
6 commentsusers have commented on this narrative
22 likesusers have liked this narrative