
Advertisement
- China
- /
- Auto Components
- /
- SHSE:605228
Shentong Technology Group Co., Ltd's (SHSE:605228) Shares Climb 29% But Its Business Is Yet to Catch Up
The Shentong Technology Group Co., Ltd (SHSE:605228) share price has done very well over the last month, posting an excellent gain of 29%. Looking back a bit further, it's encouraging to see the stock is up 35% in the last year.
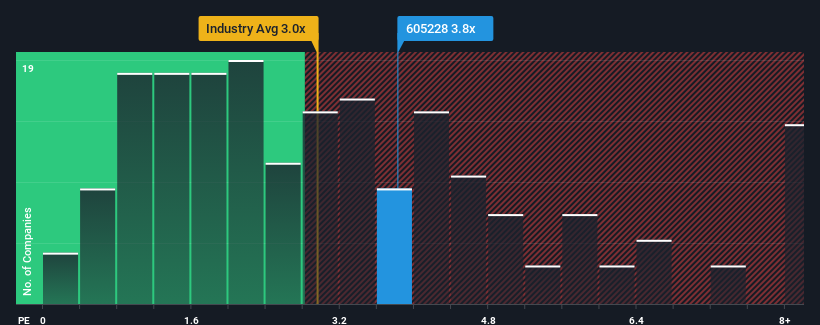
Since its price has surged higher, given close to half the companies operating in China's Auto Components industry have price-to-sales ratios (or "P/S") below 3x, you may consider Shentong Technology Group as a stock to potentially avoid with its 3.8x P/S ratio. Nonetheless, we'd need to dig a little deeper to determine if there is a rational basis for the elevated P/S.
See our latest analysis for Shentong Technology Group
How Shentong Technology Group Has Been Performing
The recent revenue growth at Shentong Technology Group would have to be considered satisfactory if not spectacular. One possibility is that the P/S ratio is high because investors think this good revenue growth will be enough to outperform the broader industry in the near future. However, if this isn't the case, investors might get caught out paying too much for the stock.
Although there are no analyst estimates available for Shentong Technology Group, take a look at this free data-rich visualisation to see how the company stacks up on earnings, revenue and cash flow.What Are Revenue Growth Metrics Telling Us About The High P/S?
In order to justify its P/S ratio, Shentong Technology Group would need to produce impressive growth in excess of the industry.
If we review the last year of revenue growth, the company posted a worthy increase of 4.4%. Revenue has also lifted 5.3% in aggregate from three years ago, partly thanks to the last 12 months of growth. So we can start by confirming that the company has actually done a good job of growing revenue over that time.
This is in contrast to the rest of the industry, which is expected to grow by 25% over the next year, materially higher than the company's recent medium-term annualised growth rates.
With this in mind, we find it worrying that Shentong Technology Group's P/S exceeds that of its industry peers. Apparently many investors in the company are way more bullish than recent times would indicate and aren't willing to let go of their stock at any price. Only the boldest would assume these prices are sustainable as a continuation of recent revenue trends is likely to weigh heavily on the share price eventually.
The Final Word
The large bounce in Shentong Technology Group's shares has lifted the company's P/S handsomely. It's argued the price-to-sales ratio is an inferior measure of value within certain industries, but it can be a powerful business sentiment indicator.
Our examination of Shentong Technology Group revealed its poor three-year revenue trends aren't detracting from the P/S as much as we though, given they look worse than current industry expectations. When we see slower than industry revenue growth but an elevated P/S, there's considerable risk of the share price declining, sending the P/S lower. Unless there is a significant improvement in the company's medium-term performance, it will be difficult to prevent the P/S ratio from declining to a more reasonable level.
There are also other vital risk factors to consider and we've discovered 3 warning signs for Shentong Technology Group (1 makes us a bit uncomfortable!) that you should be aware of before investing here.
If you're unsure about the strength of Shentong Technology Group's business, why not explore our interactive list of stocks with solid business fundamentals for some other companies you may have missed.
New: Manage All Your Stock Portfolios in One Place
We've created the ultimate portfolio companion for stock investors, and it's free.
• Connect an unlimited number of Portfolios and see your total in one currency
• Be alerted to new Warning Signs or Risks via email or mobile
• Track the Fair Value of your stocks
Have feedback on this article? Concerned about the content? Get in touch with us directly. Alternatively, email editorial-team (at) simplywallst.com.
This article by Simply Wall St is general in nature. We provide commentary based on historical data and analyst forecasts only using an unbiased methodology and our articles are not intended to be financial advice. It does not constitute a recommendation to buy or sell any stock, and does not take account of your objectives, or your financial situation. We aim to bring you long-term focused analysis driven by fundamental data. Note that our analysis may not factor in the latest price-sensitive company announcements or qualitative material. Simply Wall St has no position in any stocks mentioned.
About SHSE:605228
Shentong Technology Group
Develops, manufactures, and sells automotive parts in China.
Excellent balance sheet with proven track record.
Market Insights

Advertisement
Community Narratives
MINISO's fair value is projected at 26.69 with an anticipated PE ratio shift of 20x
Fair Value US$24.03|11.0% undervalued
BE
Community Contributor
Procter & Gamble: A Dividend Giant Facing Slowing Growth
Fair Value US$119.81|23.3% overvalued
AN
Community Contributor
Eli Lilly's Future Growth Driven by Tirzepatide and Favorable Market Conditions
Fair Value US$1.19k|13.8% undervalued
EA
Community Contributor