- China
- /
- Auto Components
- /
- SHSE:603982
Improved Revenues Required Before Nanjing Chervon Auto Precision Technology Co., Ltd (SHSE:603982) Stock's 30% Jump Looks Justified

Nanjing Chervon Auto Precision Technology Co., Ltd (SHSE:603982) shareholders are no doubt pleased to see that the share price has bounced 30% in the last month, although it is still struggling to make up recently lost ground. Unfortunately, the gains of the last month did little to right the losses of the last year with the stock still down 39% over that time.
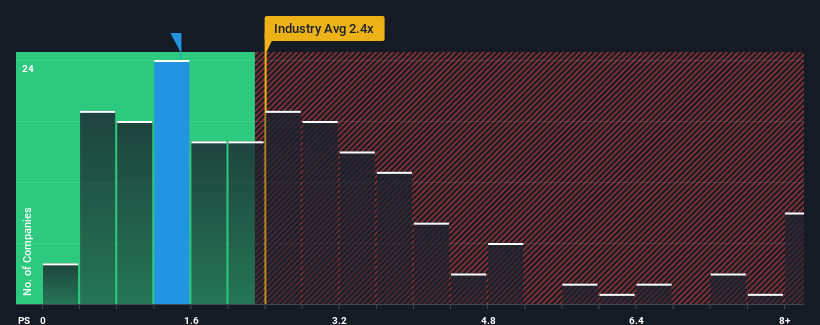
In spite of the firm bounce in price, given about half the companies operating in China's Auto Components industry have price-to-sales ratios (or "P/S") above 2.4x, you may still consider Nanjing Chervon Auto Precision Technology as an attractive investment with its 1.5x P/S ratio. Although, it's not wise to just take the P/S at face value as there may be an explanation why it's limited.
View our latest analysis for Nanjing Chervon Auto Precision Technology
How Has Nanjing Chervon Auto Precision Technology Performed Recently?
Revenue has risen firmly for Nanjing Chervon Auto Precision Technology recently, which is pleasing to see. One possibility is that the P/S is low because investors think this respectable revenue growth might actually underperform the broader industry in the near future. If that doesn't eventuate, then existing shareholders have reason to be optimistic about the future direction of the share price.
We don't have analyst forecasts, but you can see how recent trends are setting up the company for the future by checking out our free report on Nanjing Chervon Auto Precision Technology's earnings, revenue and cash flow.Do Revenue Forecasts Match The Low P/S Ratio?
The only time you'd be truly comfortable seeing a P/S as low as Nanjing Chervon Auto Precision Technology's is when the company's growth is on track to lag the industry.
Taking a look back first, we see that the company grew revenue by an impressive 23% last year. The strong recent performance means it was also able to grow revenue by 55% in total over the last three years. So we can start by confirming that the company has done a great job of growing revenue over that time.
Comparing that to the industry, which is predicted to deliver 26% growth in the next 12 months, the company's momentum is weaker, based on recent medium-term annualised revenue results.
With this information, we can see why Nanjing Chervon Auto Precision Technology is trading at a P/S lower than the industry. It seems most investors are expecting to see the recent limited growth rates continue into the future and are only willing to pay a reduced amount for the stock.
The Final Word
The latest share price surge wasn't enough to lift Nanjing Chervon Auto Precision Technology's P/S close to the industry median. We'd say the price-to-sales ratio's power isn't primarily as a valuation instrument but rather to gauge current investor sentiment and future expectations.
As we suspected, our examination of Nanjing Chervon Auto Precision Technology revealed its three-year revenue trends are contributing to its low P/S, given they look worse than current industry expectations. Right now shareholders are accepting the low P/S as they concede future revenue probably won't provide any pleasant surprises. If recent medium-term revenue trends continue, it's hard to see the share price experience a reversal of fortunes anytime soon.
Having said that, be aware Nanjing Chervon Auto Precision Technology is showing 2 warning signs in our investment analysis, you should know about.
If these risks are making you reconsider your opinion on Nanjing Chervon Auto Precision Technology, explore our interactive list of high quality stocks to get an idea of what else is out there.
Mobile Infrastructure for Defense and Disaster
The next wave in robotics isn't humanoid. Its fully autonomous towers delivering 5G, ISR, and radar in under 30 minutes, anywhere.
Get the investor briefing before the next round of contracts
Sponsored On Behalf of CiTechValuation is complex, but we're here to simplify it.
Discover if Nanjing Chervon Auto Precision Technology might be undervalued or overvalued with our detailed analysis, featuring fair value estimates, potential risks, dividends, insider trades, and its financial condition.
Access Free AnalysisHave feedback on this article? Concerned about the content? Get in touch with us directly. Alternatively, email editorial-team (at) simplywallst.com.
This article by Simply Wall St is general in nature. We provide commentary based on historical data and analyst forecasts only using an unbiased methodology and our articles are not intended to be financial advice. It does not constitute a recommendation to buy or sell any stock, and does not take account of your objectives, or your financial situation. We aim to bring you long-term focused analysis driven by fundamental data. Note that our analysis may not factor in the latest price-sensitive company announcements or qualitative material. Simply Wall St has no position in any stocks mentioned.
About SHSE:603982
Nanjing Chervon Auto Precision Technology
Nanjing Chervon Auto Precision Technology Co., Ltd.
Mediocre balance sheet and slightly overvalued.
Market Insights

Weekly Picks

THE KINGDOM OF BROWN GOODS: WHY MGPI IS BEING CRUSHED BY INVENTORY & PRIMED FOR RESURRECTION


Why Vertical Aerospace (NYSE: EVTL) is Worth Possibly Over 13x its Current Price


The Quiet Giant That Became AI’s Power Grid
Recently Updated Narratives


A tech powerhouse quietly powering the world’s AI infrastructure.


Keppel DC REIT (SGX: AJBU) is a resilient gem in the data center space.
Why Vertical Aerospace (NYSE: EVTL) is Worth Possibly Over 13x its Current Price
Popular Narratives

MicroVision will explode future revenue by 380.37% with a vision towards success


Crazy Undervalued 42 Baggers Silver Play (Active & Running Mine)


