- Chile
- /
- General Merchandise and Department Stores
- /
- SNSE:RIPLEY
Ripley (SNSE:RIPLEY) May Have Issues Allocating Its Capital


What trends should we look for it we want to identify stocks that can multiply in value over the long term? Firstly, we'd want to identify a growing return on capital employed (ROCE) and then alongside that, an ever-increasing base of capital employed. Basically this means that a company has profitable initiatives that it can continue to reinvest in, which is a trait of a compounding machine. However, after briefly looking over the numbers, we don't think Ripley (SNSE:RIPLEY) has the makings of a multi-bagger going forward, but let's have a look at why that may be.
What Is Return On Capital Employed (ROCE)?
For those who don't know, ROCE is a measure of a company's yearly pre-tax profit (its return), relative to the capital employed in the business. Analysts use this formula to calculate it for Ripley:
Return on Capital Employed = Earnings Before Interest and Tax (EBIT) ÷ (Total Assets - Current Liabilities)
0.0068 = CL$15b ÷ (CL$3.9t - CL$1.7t) (Based on the trailing twelve months to December 2022).
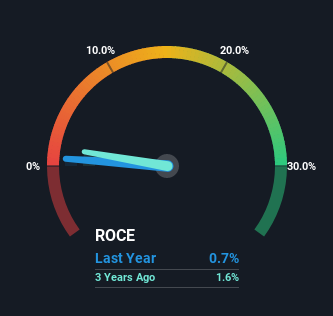
Therefore, Ripley has an ROCE of 0.7%. In absolute terms, that's a low return and it also under-performs the Multiline Retail industry average of 7.3%.
View our latest analysis for Ripley
In the above chart we have measured Ripley's prior ROCE against its prior performance, but the future is arguably more important. If you'd like, you can check out the forecasts from the analysts covering Ripley here for free.
SWOT Analysis for Ripley
- Debt is well covered by .
- Earnings declined over the past year.
- Interest payments on debt are not well covered.
- Dividend is low compared to the top 25% of dividend payers in the Multiline Retail market.
- Current share price is above our estimate of fair value.
- Annual revenue is forecast to grow faster than the Chilean market.
- Debt is not well covered by operating cash flow.
- Paying a dividend but company has no free cash flows.
What The Trend Of ROCE Can Tell Us
When we looked at the ROCE trend at Ripley, we didn't gain much confidence. Around five years ago the returns on capital were 4.6%, but since then they've fallen to 0.7%. On the other hand, the company has been employing more capital without a corresponding improvement in sales in the last year, which could suggest these investments are longer term plays. It's worth keeping an eye on the company's earnings from here on to see if these investments do end up contributing to the bottom line.
Another thing to note, Ripley has a high ratio of current liabilities to total assets of 44%. This effectively means that suppliers (or short-term creditors) are funding a large portion of the business, so just be aware that this can introduce some elements of risk. Ideally we'd like to see this reduce as that would mean fewer obligations bearing risks.
In Conclusion...
To conclude, we've found that Ripley is reinvesting in the business, but returns have been falling. Since the stock has declined 67% over the last five years, investors may not be too optimistic on this trend improving either. Therefore based on the analysis done in this article, we don't think Ripley has the makings of a multi-bagger.
Since virtually every company faces some risks, it's worth knowing what they are, and we've spotted 6 warning signs for Ripley (of which 2 are potentially serious!) that you should know about.
While Ripley isn't earning the highest return, check out this free list of companies that are earning high returns on equity with solid balance sheets.
New: AI Stock Screener & Alerts
Our new AI Stock Screener scans the market every day to uncover opportunities.
• Dividend Powerhouses (3%+ Yield)
• Undervalued Small Caps with Insider Buying
• High growth Tech and AI Companies
Or build your own from over 50 metrics.
Have feedback on this article? Concerned about the content? Get in touch with us directly. Alternatively, email editorial-team (at) simplywallst.com.
This article by Simply Wall St is general in nature. We provide commentary based on historical data and analyst forecasts only using an unbiased methodology and our articles are not intended to be financial advice. It does not constitute a recommendation to buy or sell any stock, and does not take account of your objectives, or your financial situation. We aim to bring you long-term focused analysis driven by fundamental data. Note that our analysis may not factor in the latest price-sensitive company announcements or qualitative material. Simply Wall St has no position in any stocks mentioned.
About SNSE:RIPLEY
Ripley
Engages in the retail sale of apparel, accessories, and home products through department stores and e-commerce in Chile and Peru.
Reasonable growth potential and slightly overvalued.
Market Insights

Community Narratives
