- Chile
- /
- General Merchandise and Department Stores
- /
- SNSE:FALABELLA
Estimating The Fair Value Of Falabella S.A. (SNSE:FALABELLA)

Key Insights
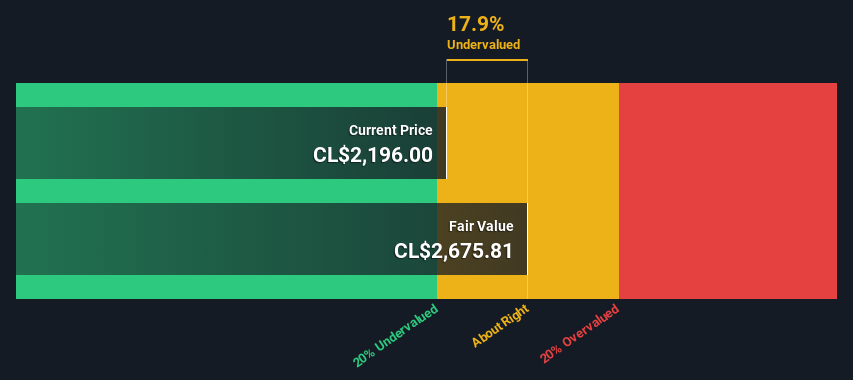
- Falabella's estimated fair value is CL$2,676 based on 2 Stage Free Cash Flow to Equity
- With CL$2,196 share price, Falabella appears to be trading close to its estimated fair value
- The CL$2,171 analyst price target for FALABELLA is 19% less than our estimate of fair value
How far off is Falabella S.A. (SNSE:FALABELLA) from its intrinsic value? Using the most recent financial data, we'll take a look at whether the stock is fairly priced by estimating the company's future cash flows and discounting them to their present value. One way to achieve this is by employing the Discounted Cash Flow (DCF) model. Don't get put off by the jargon, the math behind it is actually quite straightforward.
We would caution that there are many ways of valuing a company and, like the DCF, each technique has advantages and disadvantages in certain scenarios. If you still have some burning questions about this type of valuation, take a look at the Simply Wall St analysis model.
See our latest analysis for Falabella
What's The Estimated Valuation?
We are going to use a two-stage DCF model, which, as the name states, takes into account two stages of growth. The first stage is generally a higher growth period which levels off heading towards the terminal value, captured in the second 'steady growth' period. In the first stage we need to estimate the cash flows to the business over the next ten years. Where possible we use analyst estimates, but when these aren't available we extrapolate the previous free cash flow (FCF) from the last estimate or reported value. We assume companies with shrinking free cash flow will slow their rate of shrinkage, and that companies with growing free cash flow will see their growth rate slow, over this period. We do this to reflect that growth tends to slow more in the early years than it does in later years.
Generally we assume that a dollar today is more valuable than a dollar in the future, so we discount the value of these future cash flows to their estimated value in today's dollars:
10-year free cash flow (FCF) estimate
| 2024 | 2025 | 2026 | 2027 | 2028 | 2029 | 2030 | 2031 | 2032 | 2033 | |
| Levered FCF (CLP, Millions) | CL$780.0b | CL$999.0b | CL$884.6b | CL$825.8b | CL$798.6b | CL$791.0b | CL$796.6b | CL$811.4b | CL$832.9b | CL$859.8b |
| Growth Rate Estimate Source | Analyst x1 | Analyst x1 | Est @ -11.45% | Est @ -6.65% | Est @ -3.29% | Est @ -0.94% | Est @ 0.70% | Est @ 1.85% | Est @ 2.66% | Est @ 3.22% |
| Present Value (CLP, Millions) Discounted @ 14% | CL$681.8k | CL$763.4k | CL$590.9k | CL$482.2k | CL$407.6k | CL$352.9k | CL$310.7k | CL$276.6k | CL$248.2k | CL$224.0k |
("Est" = FCF growth rate estimated by Simply Wall St)
Present Value of 10-year Cash Flow (PVCF) = CL$4.3t
The second stage is also known as Terminal Value, this is the business's cash flow after the first stage. For a number of reasons a very conservative growth rate is used that cannot exceed that of a country's GDP growth. In this case we have used the 5-year average of the 10-year government bond yield (4.5%) to estimate future growth. In the same way as with the 10-year 'growth' period, we discount future cash flows to today's value, using a cost of equity of 14%.
Terminal Value (TV)= FCF2033 × (1 + g) ÷ (r – g) = CL$860b× (1 + 4.5%) ÷ (14%– 4.5%) = CL$9.1t
Present Value of Terminal Value (PVTV)= TV / (1 + r)10= CL$9.1t÷ ( 1 + 14%)10= CL$2.4t
The total value, or equity value, is then the sum of the present value of the future cash flows, which in this case is CL$6.7t. The last step is to then divide the equity value by the number of shares outstanding. Relative to the current share price of CL$2.2k, the company appears about fair value at a 18% discount to where the stock price trades currently. Remember though, that this is just an approximate valuation, and like any complex formula - garbage in, garbage out.
Important Assumptions
We would point out that the most important inputs to a discounted cash flow are the discount rate and of course the actual cash flows. You don't have to agree with these inputs, I recommend redoing the calculations yourself and playing with them. The DCF also does not consider the possible cyclicality of an industry, or a company's future capital requirements, so it does not give a full picture of a company's potential performance. Given that we are looking at Falabella as potential shareholders, the cost of equity is used as the discount rate, rather than the cost of capital (or weighted average cost of capital, WACC) which accounts for debt. In this calculation we've used 14%, which is based on a levered beta of 1.570. Beta is a measure of a stock's volatility, compared to the market as a whole. We get our beta from the industry average beta of globally comparable companies, with an imposed limit between 0.8 and 2.0, which is a reasonable range for a stable business.
SWOT Analysis for Falabella
- Debt is well covered by cash flow.
- Interest payments on debt are not well covered.
- Expected to breakeven next year.
- Has sufficient cash runway for more than 3 years based on current free cash flows.
- Current share price is below our estimate of fair value.
- No apparent threats visible for FALABELLA.
Moving On:
Valuation is only one side of the coin in terms of building your investment thesis, and it is only one of many factors that you need to assess for a company. It's not possible to obtain a foolproof valuation with a DCF model. Instead the best use for a DCF model is to test certain assumptions and theories to see if they would lead to the company being undervalued or overvalued. If a company grows at a different rate, or if its cost of equity or risk free rate changes sharply, the output can look very different. For Falabella, we've compiled three relevant items you should further research:
- Risks: Every company has them, and we've spotted 2 warning signs for Falabella (of which 1 is a bit concerning!) you should know about.
- Future Earnings: How does FALABELLA's growth rate compare to its peers and the wider market? Dig deeper into the analyst consensus number for the upcoming years by interacting with our free analyst growth expectation chart.
- Other Solid Businesses: Low debt, high returns on equity and good past performance are fundamental to a strong business. Why not explore our interactive list of stocks with solid business fundamentals to see if there are other companies you may not have considered!
PS. The Simply Wall St app conducts a discounted cash flow valuation for every stock on the SNSE every day. If you want to find the calculation for other stocks just search here.
New: AI Stock Screener & Alerts
Our new AI Stock Screener scans the market every day to uncover opportunities.
• Dividend Powerhouses (3%+ Yield)
• Undervalued Small Caps with Insider Buying
• High growth Tech and AI Companies
Or build your own from over 50 metrics.
Have feedback on this article? Concerned about the content? Get in touch with us directly. Alternatively, email editorial-team (at) simplywallst.com.
This article by Simply Wall St is general in nature. We provide commentary based on historical data and analyst forecasts only using an unbiased methodology and our articles are not intended to be financial advice. It does not constitute a recommendation to buy or sell any stock, and does not take account of your objectives, or your financial situation. We aim to bring you long-term focused analysis driven by fundamental data. Note that our analysis may not factor in the latest price-sensitive company announcements or qualitative material. Simply Wall St has no position in any stocks mentioned.
About SNSE:FALABELLA
Falabella
Engages in the retail sale of clothing, accessories, home products, electronics, and beauty and other products in Chile, Peru, Colombia, Brazil, Mexico, Uruguay, and Argentina.
Proven track record with adequate balance sheet.

