
Advertisement
- Switzerland
- /
- Life Sciences
- /
- SWX:LONN
Lonza Group AG's (VTX:LONN) Stock Has Been Sliding But Fundamentals Look Strong: Is The Market Wrong?

With its stock down 18% over the past three months, it is easy to disregard Lonza Group (VTX:LONN). But if you pay close attention, you might gather that its strong financials could mean that the stock could potentially see an increase in value in the long-term, given how markets usually reward companies with good financial health. In this article, we decided to focus on Lonza Group's ROE.
ROE or return on equity is a useful tool to assess how effectively a company can generate returns on the investment it received from its shareholders. In other words, it is a profitability ratio which measures the rate of return on the capital provided by the company's shareholders.
See our latest analysis for Lonza Group
How Do You Calculate Return On Equity?
ROE can be calculated by using the formula:
Return on Equity = Net Profit (from continuing operations) ÷ Shareholders' Equity
So, based on the above formula, the ROE for Lonza Group is:
11% = CHF1.1b ÷ CHF10b (Based on the trailing twelve months to June 2023).
The 'return' is the yearly profit. So, this means that for every CHF1 of its shareholder's investments, the company generates a profit of CHF0.11.
What Has ROE Got To Do With Earnings Growth?
So far, we've learned that ROE is a measure of a company's profitability. Based on how much of its profits the company chooses to reinvest or "retain", we are then able to evaluate a company's future ability to generate profits. Assuming everything else remains unchanged, the higher the ROE and profit retention, the higher the growth rate of a company compared to companies that don't necessarily bear these characteristics.
Lonza Group's Earnings Growth And 11% ROE
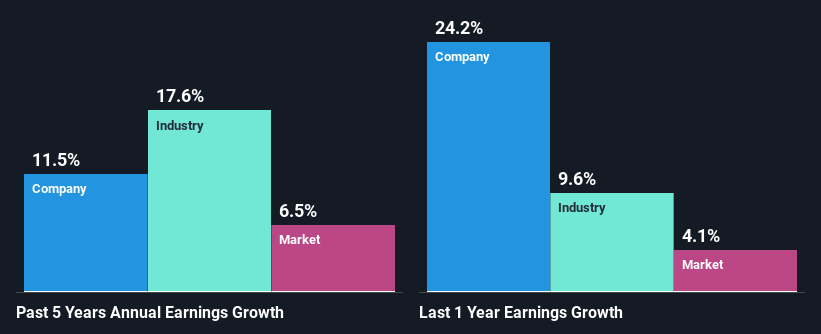
At first glance, Lonza Group seems to have a decent ROE. Further, the company's ROE is similar to the industry average of 9.5%. Consequently, this likely laid the ground for the decent growth of 11% seen over the past five years by Lonza Group.
Next, on comparing with the industry net income growth, we found that Lonza Group's reported growth was lower than the industry growth of 18% over the last few years, which is not something we like to see.
The basis for attaching value to a company is, to a great extent, tied to its earnings growth. What investors need to determine next is if the expected earnings growth, or the lack of it, is already built into the share price. By doing so, they will have an idea if the stock is headed into clear blue waters or if swampy waters await. What is LONN worth today? The intrinsic value infographic in our free research report helps visualize whether LONN is currently mispriced by the market.
Is Lonza Group Making Efficient Use Of Its Profits?
With a three-year median payout ratio of 29% (implying that the company retains 71% of its profits), it seems that Lonza Group is reinvesting efficiently in a way that it sees respectable amount growth in its earnings and pays a dividend that's well covered.
Besides, Lonza Group has been paying dividends for at least ten years or more. This shows that the company is committed to sharing profits with its shareholders. Upon studying the latest analysts' consensus data, we found that the company is expected to keep paying out approximately 33% of its profits over the next three years. As a result, Lonza Group's ROE is not expected to change by much either, which we inferred from the analyst estimate of 11% for future ROE.
Summary
Overall, we are quite pleased with Lonza Group's performance. In particular, it's great to see that the company is investing heavily into its business and along with a high rate of return, that has resulted in a respectable growth in its earnings. Having said that, the company's earnings growth is expected to slow down, as forecasted in the current analyst estimates. Are these analysts expectations based on the broad expectations for the industry, or on the company's fundamentals? Click here to be taken to our analyst's forecasts page for the company.
New: AI Stock Screener & Alerts
Our new AI Stock Screener scans the market every day to uncover opportunities.
• Dividend Powerhouses (3%+ Yield)
• Undervalued Small Caps with Insider Buying
• High growth Tech and AI Companies
Or build your own from over 50 metrics.
Have feedback on this article? Concerned about the content? Get in touch with us directly. Alternatively, email editorial-team (at) simplywallst.com.
This article by Simply Wall St is general in nature. We provide commentary based on historical data and analyst forecasts only using an unbiased methodology and our articles are not intended to be financial advice. It does not constitute a recommendation to buy or sell any stock, and does not take account of your objectives, or your financial situation. We aim to bring you long-term focused analysis driven by fundamental data. Note that our analysis may not factor in the latest price-sensitive company announcements or qualitative material. Simply Wall St has no position in any stocks mentioned.
About SWX:LONN
Lonza Group
Supplies various products and services for pharmaceutical, biotech, and nutrition markets in Europe, North and Central America, Latin America, Asia, Australia, New Zealand, and internationally.
Excellent balance sheet with reasonable growth potential.
Similar Companies
Market Insights


Advertisement
Community Narratives
For the Emperor: Why Games Workshop Could Be a Star Investment
Fair Value UK£160.00|0.1% overvalued
RO
Community Contributor
Securitas will boost margins with AI and tech-driven services
Fair Value SEK 260.91|44.5% undervalued
UN
Community Contributor
A Leader in EV Charging with Growth Potential
Fair Value €27.00|20.9% undervalued
TI
Community Contributor