
Advertisement
- Switzerland
- /
- Healthcare Services
- /
- SWX:GALE
Galenica's (VTX:GALE) five-year total shareholder returns outpace the underlying earnings growth

These days it's easy to simply buy an index fund, and your returns should (roughly) match the market. But in our experience, buying the right stocks can give your wealth a significant boost. For example, the Galenica AG (VTX:GALE) share price is up 19% in the last five years, slightly above the market return. It's also good to see that the stock is up 18% in a year.
Since the long term performance has been good but there's been a recent pullback of 4.8%, let's check if the fundamentals match the share price.
We check all companies for important risks. See what we found for Galenica in our free report.To paraphrase Benjamin Graham: Over the short term the market is a voting machine, but over the long term it's a weighing machine. One imperfect but simple way to consider how the market perception of a company has shifted is to compare the change in the earnings per share (EPS) with the share price movement.
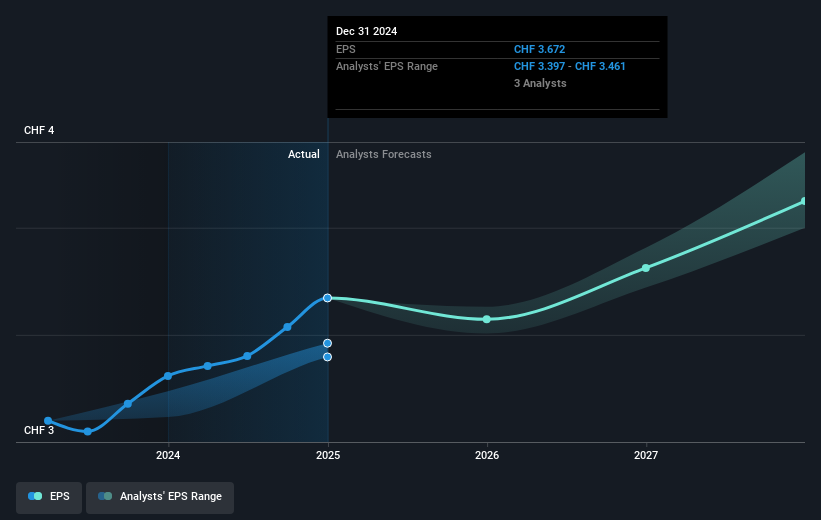
During five years of share price growth, Galenica achieved compound earnings per share (EPS) growth of 7.7% per year. This EPS growth is higher than the 4% average annual increase in the share price. So it seems the market isn't so enthusiastic about the stock these days.
The image below shows how EPS has tracked over time (if you click on the image you can see greater detail).
We know that Galenica has improved its bottom line lately, but is it going to grow revenue? You could check out this free report showing analyst revenue forecasts.
What About Dividends?
When looking at investment returns, it is important to consider the difference between total shareholder return (TSR) and share price return. Whereas the share price return only reflects the change in the share price, the TSR includes the value of dividends (assuming they were reinvested) and the benefit of any discounted capital raising or spin-off. It's fair to say that the TSR gives a more complete picture for stocks that pay a dividend. As it happens, Galenica's TSR for the last 5 years was 42%, which exceeds the share price return mentioned earlier. This is largely a result of its dividend payments!
A Different Perspective
It's good to see that Galenica has rewarded shareholders with a total shareholder return of 21% in the last twelve months. That's including the dividend. That's better than the annualised return of 7% over half a decade, implying that the company is doing better recently. In the best case scenario, this may hint at some real business momentum, implying that now could be a great time to delve deeper. Is Galenica cheap compared to other companies? These 3 valuation measures might help you decide.
If you like to buy stocks alongside management, then you might just love this free list of companies. (Hint: many of them are unnoticed AND have attractive valuation).
Please note, the market returns quoted in this article reflect the market weighted average returns of stocks that currently trade on Swiss exchanges.
New: Manage All Your Stock Portfolios in One Place
We've created the ultimate portfolio companion for stock investors, and it's free.
• Connect an unlimited number of Portfolios and see your total in one currency
• Be alerted to new Warning Signs or Risks via email or mobile
• Track the Fair Value of your stocks
Have feedback on this article? Concerned about the content? Get in touch with us directly. Alternatively, email editorial-team (at) simplywallst.com.
This article by Simply Wall St is general in nature. We provide commentary based on historical data and analyst forecasts only using an unbiased methodology and our articles are not intended to be financial advice. It does not constitute a recommendation to buy or sell any stock, and does not take account of your objectives, or your financial situation. We aim to bring you long-term focused analysis driven by fundamental data. Note that our analysis may not factor in the latest price-sensitive company announcements or qualitative material. Simply Wall St has no position in any stocks mentioned.
About SWX:GALE
Galenica
Operates as a healthcare service provider in Switzerland and internationally.
Flawless balance sheet with proven track record.
Similar Companies
Market Insights

Advertisement
Community Narratives

Apple: A Dying Star with an Overpriced Valuation
Fair Value US$177.34|20.1% overvalued
IN
Community Contributor
Avino a case for USD$20 per share within 5 years (assuming $3,500 gold, $100 silver and $4 copper).
Fair Value CA$26.79|87.5% undervalued
AG
Community Contributor
Riding the Defense Boom RENK Sees Revenue Climb at 15% CAGR by FY 2029
Fair Value €69.87|20.5% undervalued
CH
Community Contributor