
Advertisement
- Switzerland
- /
- Capital Markets
- /
- SWX:EFGN
EFG International (VTX:EFGN) stock performs better than its underlying earnings growth over last three years
By buying an index fund, you can roughly match the market return with ease. But if you pick the right individual stocks, you could make more than that. For example, EFG International AG (VTX:EFGN) shareholders have seen the share price rise 76% over three years, well in excess of the market return (0.2%, not including dividends). However, more recent returns haven't been as impressive as that, with the stock returning just 34% in the last year , including dividends .
Since the stock has added CHF128m to its market cap in the past week alone, let's see if underlying performance has been driving long-term returns.
View our latest analysis for EFG International
To quote Buffett, 'Ships will sail around the world but the Flat Earth Society will flourish. There will continue to be wide discrepancies between price and value in the marketplace...' One imperfect but simple way to consider how the market perception of a company has shifted is to compare the change in the earnings per share (EPS) with the share price movement.
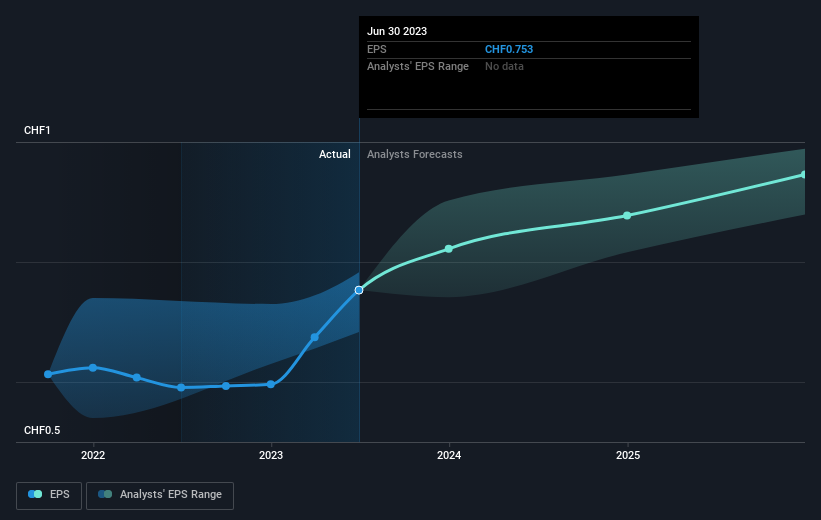
EFG International was able to grow its EPS at 31% per year over three years, sending the share price higher. The average annual share price increase of 21% is actually lower than the EPS growth. Therefore, it seems the market has moderated its expectations for growth, somewhat.
The image below shows how EPS has tracked over time (if you click on the image you can see greater detail).
We know that EFG International has improved its bottom line over the last three years, but what does the future have in store? You can see how its balance sheet has strengthened (or weakened) over time in this free interactive graphic.
What About Dividends?
When looking at investment returns, it is important to consider the difference between total shareholder return (TSR) and share price return. The TSR incorporates the value of any spin-offs or discounted capital raisings, along with any dividends, based on the assumption that the dividends are reinvested. Arguably, the TSR gives a more comprehensive picture of the return generated by a stock. As it happens, EFG International's TSR for the last 3 years was 108%, which exceeds the share price return mentioned earlier. And there's no prize for guessing that the dividend payments largely explain the divergence!
A Different Perspective
We're pleased to report that EFG International shareholders have received a total shareholder return of 34% over one year. And that does include the dividend. That gain is better than the annual TSR over five years, which is 14%. Therefore it seems like sentiment around the company has been positive lately. Someone with an optimistic perspective could view the recent improvement in TSR as indicating that the business itself is getting better with time. I find it very interesting to look at share price over the long term as a proxy for business performance. But to truly gain insight, we need to consider other information, too. Take risks, for example - EFG International has 2 warning signs we think you should be aware of.
For those who like to find winning investments this free list of growing companies with recent insider purchasing, could be just the ticket.
Please note, the market returns quoted in this article reflect the market weighted average returns of stocks that currently trade on Swiss exchanges.
Valuation is complex, but we're here to simplify it.
Discover if EFG International might be undervalued or overvalued with our detailed analysis, featuring fair value estimates, potential risks, dividends, insider trades, and its financial condition.
Access Free AnalysisHave feedback on this article? Concerned about the content? Get in touch with us directly. Alternatively, email editorial-team (at) simplywallst.com.
This article by Simply Wall St is general in nature. We provide commentary based on historical data and analyst forecasts only using an unbiased methodology and our articles are not intended to be financial advice. It does not constitute a recommendation to buy or sell any stock, and does not take account of your objectives, or your financial situation. We aim to bring you long-term focused analysis driven by fundamental data. Note that our analysis may not factor in the latest price-sensitive company announcements or qualitative material. Simply Wall St has no position in any stocks mentioned.
About SWX:EFGN
EFG International
Provides private banking, wealth management, and asset management services.
Excellent balance sheet, good value and pays a dividend.
Similar Companies
Market Insights

Advertisement
Community Narratives
Quality at a Premium. A time to watch, not to buy?
Fair Value US$154.56|29.0% undervalued
DA
Community Contributor
GRAB: The Super-App at the Heart of Southeast Asia’s Digital Boom
Fair Value US$8.20|22.6% undervalued
BL
Community Contributor
Verve Group to Surge with 51.61% Revenue Growth
Fair Value €6.00|60.1% undervalued
ME
Community Contributor