
Advertisement

Some say volatility, rather than debt, is the best way to think about risk as an investor, but Warren Buffett famously said that 'Volatility is far from synonymous with risk.' When we think about how risky a company is, we always like to look at its use of debt, since debt overload can lead to ruin. As with many other companies SGS SA (VTX:SGSN) makes use of debt. But is this debt a concern to shareholders?
When Is Debt A Problem?
Debt and other liabilities become risky for a business when it cannot easily fulfill those obligations, either with free cash flow or by raising capital at an attractive price. Part and parcel of capitalism is the process of 'creative destruction' where failed businesses are mercilessly liquidated by their bankers. However, a more common (but still painful) scenario is that it has to raise new equity capital at a low price, thus permanently diluting shareholders. Of course, debt can be an important tool in businesses, particularly capital heavy businesses. The first thing to do when considering how much debt a business uses is to look at its cash and debt together.
Check out our latest analysis for SGS
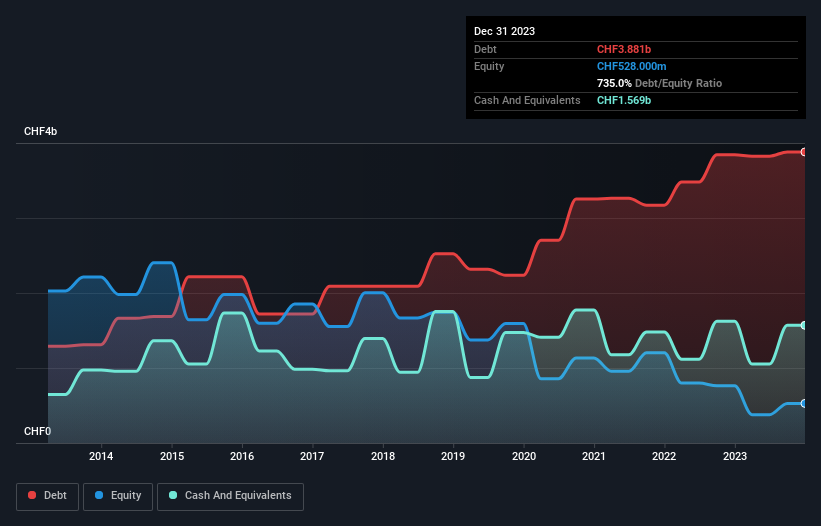
What Is SGS's Debt?
The chart below, which you can click on for greater detail, shows that SGS had CHF3.88b in debt in December 2023; about the same as the year before. However, it does have CHF1.57b in cash offsetting this, leading to net debt of about CHF2.31b.
How Healthy Is SGS' Balance Sheet?
We can see from the most recent balance sheet that SGS had liabilities of CHF2.58b falling due within a year, and liabilities of CHF3.65b due beyond that. Offsetting this, it had CHF1.57b in cash and CHF1.50b in receivables that were due within 12 months. So its liabilities total CHF3.16b more than the combination of its cash and short-term receivables.
While this might seem like a lot, it is not so bad since SGS has a huge market capitalization of CHF15.6b, and so it could probably strengthen its balance sheet by raising capital if it needed to. But we definitely want to keep our eyes open to indications that its debt is bringing too much risk.
We use two main ratios to inform us about debt levels relative to earnings. The first is net debt divided by earnings before interest, tax, depreciation, and amortization (EBITDA), while the second is how many times its earnings before interest and tax (EBIT) covers its interest expense (or its interest cover, for short). Thus we consider debt relative to earnings both with and without depreciation and amortization expenses.
SGS's net debt to EBITDA ratio of about 1.7 suggests only moderate use of debt. And its commanding EBIT of 15.2 times its interest expense, implies the debt load is as light as a peacock feather. On the other hand, SGS saw its EBIT drop by 4.2% in the last twelve months. That sort of decline, if sustained, will obviously make debt harder to handle. The balance sheet is clearly the area to focus on when you are analysing debt. But ultimately the future profitability of the business will decide if SGS can strengthen its balance sheet over time. So if you're focused on the future you can check out this free report showing analyst profit forecasts.
Finally, a company can only pay off debt with cold hard cash, not accounting profits. So we always check how much of that EBIT is translated into free cash flow. Over the last three years, SGS recorded free cash flow worth a fulsome 86% of its EBIT, which is stronger than we'd usually expect. That puts it in a very strong position to pay down debt.
Our View
Happily, SGS's impressive interest cover implies it has the upper hand on its debt. But, on a more sombre note, we are a little concerned by its EBIT growth rate. Taking all this data into account, it seems to us that SGS takes a pretty sensible approach to debt. That means they are taking on a bit more risk, in the hope of boosting shareholder returns. There's no doubt that we learn most about debt from the balance sheet. But ultimately, every company can contain risks that exist outside of the balance sheet. We've identified 2 warning signs with SGS , and understanding them should be part of your investment process.
If, after all that, you're more interested in a fast growing company with a rock-solid balance sheet, then check out our list of net cash growth stocks without delay.
New: Manage All Your Stock Portfolios in One Place
We've created the ultimate portfolio companion for stock investors, and it's free.
• Connect an unlimited number of Portfolios and see your total in one currency
• Be alerted to new Warning Signs or Risks via email or mobile
• Track the Fair Value of your stocks
Have feedback on this article? Concerned about the content? Get in touch with us directly. Alternatively, email editorial-team (at) simplywallst.com.
This article by Simply Wall St is general in nature. We provide commentary based on historical data and analyst forecasts only using an unbiased methodology and our articles are not intended to be financial advice. It does not constitute a recommendation to buy or sell any stock, and does not take account of your objectives, or your financial situation. We aim to bring you long-term focused analysis driven by fundamental data. Note that our analysis may not factor in the latest price-sensitive company announcements or qualitative material. Simply Wall St has no position in any stocks mentioned.
About SWX:SGSN
SGS
Provides inspection, testing, and certification services in Europe, Africa, the Middle East, Latin America, North America, and the Asia Pacific.
Solid track record average dividend payer.
Similar Companies
Market Insights


Advertisement
Community Narratives
Nike's Direct-to-Consumer Focus Will Drive Future Growth
Fair Value US$87.90|22.7% undervalued
UN
Community Contributor
Novo Nordisk will dominate GLP-1 market with Ozempic and Wegovy growth
Fair Value US$89.59|14.2% undervalued
BE
Community Contributor
Rheinmetall could get 20-25% of EU-NATO 3%-GDP defence spending
Fair Value €7.57k|82.8% undervalued
NO
Community Contributor