- Switzerland
- /
- Electrical
- /
- SWX:HUBN
Huber+Suhner AG's (VTX:HUBN) Intrinsic Value Is Potentially 59% Above Its Share Price

Key Insights
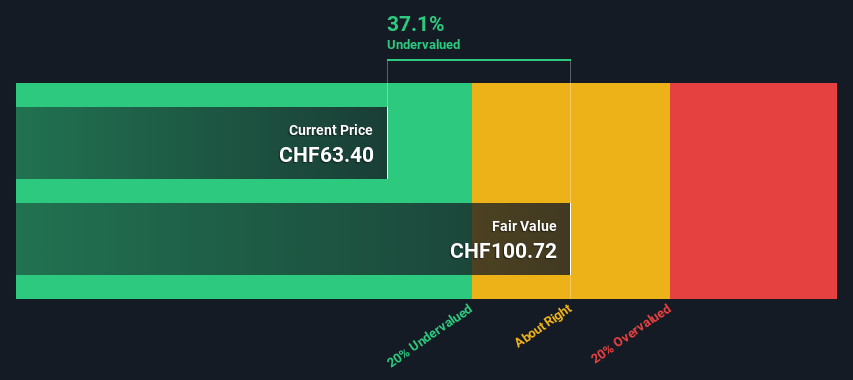
- The projected fair value for Huber+Suhner is CHF101 based on 2 Stage Free Cash Flow to Equity
- Huber+Suhner is estimated to be 37% undervalued based on current share price of CHF63.40
- Our fair value estimate is 21% higher than Huber+Suhner's analyst price target of CHF83.00
Does the February share price for Huber+Suhner AG (VTX:HUBN) reflect what it's really worth? Today, we will estimate the stock's intrinsic value by estimating the company's future cash flows and discounting them to their present value. Our analysis will employ the Discounted Cash Flow (DCF) model. It may sound complicated, but actually it is quite simple!
We would caution that there are many ways of valuing a company and, like the DCF, each technique has advantages and disadvantages in certain scenarios. For those who are keen learners of equity analysis, the Simply Wall St analysis model here may be something of interest to you.
Check out our latest analysis for Huber+Suhner
The Model
We use what is known as a 2-stage model, which simply means we have two different periods of growth rates for the company's cash flows. Generally the first stage is higher growth, and the second stage is a lower growth phase. To begin with, we have to get estimates of the next ten years of cash flows. Where possible we use analyst estimates, but when these aren't available we extrapolate the previous free cash flow (FCF) from the last estimate or reported value. We assume companies with shrinking free cash flow will slow their rate of shrinkage, and that companies with growing free cash flow will see their growth rate slow, over this period. We do this to reflect that growth tends to slow more in the early years than it does in later years.
A DCF is all about the idea that a dollar in the future is less valuable than a dollar today, so we discount the value of these future cash flows to their estimated value in today's dollars:
10-year free cash flow (FCF) forecast
| 2024 | 2025 | 2026 | 2027 | 2028 | 2029 | 2030 | 2031 | 2032 | 2033 | |
| Levered FCF (CHF, Millions) | CHF64.8m | CHF64.7m | CHF80.0m | CHF86.1m | CHF90.8m | CHF94.3m | CHF96.9m | CHF98.7m | CHF100.1m | CHF101.1m |
| Growth Rate Estimate Source | Analyst x3 | Analyst x3 | Analyst x1 | Est @ 7.68% | Est @ 5.42% | Est @ 3.83% | Est @ 2.72% | Est @ 1.94% | Est @ 1.40% | Est @ 1.02% |
| Present Value (CHF, Millions) Discounted @ 5.2% | CHF61.6 | CHF58.5 | CHF68.8 | CHF70.4 | CHF70.5 | CHF69.6 | CHF68.0 | CHF65.9 | CHF63.5 | CHF61.0 |
("Est" = FCF growth rate estimated by Simply Wall St)
Present Value of 10-year Cash Flow (PVCF) = CHF658m
The second stage is also known as Terminal Value, this is the business's cash flow after the first stage. For a number of reasons a very conservative growth rate is used that cannot exceed that of a country's GDP growth. In this case we have used the 5-year average of the 10-year government bond yield (0.1%) to estimate future growth. In the same way as with the 10-year 'growth' period, we discount future cash flows to today's value, using a cost of equity of 5.2%.
Terminal Value (TV)= FCF2033 × (1 + g) ÷ (r – g) = CHF101m× (1 + 0.1%) ÷ (5.2%– 0.1%) = CHF2.0b
Present Value of Terminal Value (PVTV)= TV / (1 + r)10= CHF2.0b÷ ( 1 + 5.2%)10= CHF1.2b
The total value, or equity value, is then the sum of the present value of the future cash flows, which in this case is CHF1.9b. In the final step we divide the equity value by the number of shares outstanding. Compared to the current share price of CHF63.4, the company appears quite good value at a 37% discount to where the stock price trades currently. Valuations are imprecise instruments though, rather like a telescope - move a few degrees and end up in a different galaxy. Do keep this in mind.
Important Assumptions
The calculation above is very dependent on two assumptions. The first is the discount rate and the other is the cash flows. Part of investing is coming up with your own evaluation of a company's future performance, so try the calculation yourself and check your own assumptions. The DCF also does not consider the possible cyclicality of an industry, or a company's future capital requirements, so it does not give a full picture of a company's potential performance. Given that we are looking at Huber+Suhner as potential shareholders, the cost of equity is used as the discount rate, rather than the cost of capital (or weighted average cost of capital, WACC) which accounts for debt. In this calculation we've used 5.2%, which is based on a levered beta of 1.098. Beta is a measure of a stock's volatility, compared to the market as a whole. We get our beta from the industry average beta of globally comparable companies, with an imposed limit between 0.8 and 2.0, which is a reasonable range for a stable business.
SWOT Analysis for Huber+Suhner
- Currently debt free.
- Dividends are covered by earnings and cash flows.
- Earnings declined over the past year.
- Dividend is low compared to the top 25% of dividend payers in the Electrical market.
- Annual earnings are forecast to grow for the next 4 years.
- Good value based on P/E ratio and estimated fair value.
- Annual earnings are forecast to grow slower than the Swiss market.
Looking Ahead:
Valuation is only one side of the coin in terms of building your investment thesis, and it shouldn't be the only metric you look at when researching a company. It's not possible to obtain a foolproof valuation with a DCF model. Instead the best use for a DCF model is to test certain assumptions and theories to see if they would lead to the company being undervalued or overvalued. If a company grows at a different rate, or if its cost of equity or risk free rate changes sharply, the output can look very different. What is the reason for the share price sitting below the intrinsic value? For Huber+Suhner, there are three relevant elements you should look at:
- Risks: Take risks, for example - Huber+Suhner has 1 warning sign we think you should be aware of.
- Future Earnings: How does HUBN's growth rate compare to its peers and the wider market? Dig deeper into the analyst consensus number for the upcoming years by interacting with our free analyst growth expectation chart.
- Other Solid Businesses: Low debt, high returns on equity and good past performance are fundamental to a strong business. Why not explore our interactive list of stocks with solid business fundamentals to see if there are other companies you may not have considered!
PS. The Simply Wall St app conducts a discounted cash flow valuation for every stock on the SWX every day. If you want to find the calculation for other stocks just search here.
The New Payments ETF Is Live on NASDAQ:
Money is moving to real-time rails, and a newly listed ETF now gives investors direct exposure. Fast settlement. Institutional custody. Simple access.
Explore how this launch could reshape portfolios
Sponsored ContentValuation is complex, but we're here to simplify it.
Discover if Huber+Suhner might be undervalued or overvalued with our detailed analysis, featuring fair value estimates, potential risks, dividends, insider trades, and its financial condition.
Access Free AnalysisHave feedback on this article? Concerned about the content? Get in touch with us directly. Alternatively, email editorial-team (at) simplywallst.com.
This article by Simply Wall St is general in nature. We provide commentary based on historical data and analyst forecasts only using an unbiased methodology and our articles are not intended to be financial advice. It does not constitute a recommendation to buy or sell any stock, and does not take account of your objectives, or your financial situation. We aim to bring you long-term focused analysis driven by fundamental data. Note that our analysis may not factor in the latest price-sensitive company announcements or qualitative material. Simply Wall St has no position in any stocks mentioned.
About SWX:HUBN
Huber+Suhner
Engages in the provision of electrical and optical connectivity components and system solutions.
Flawless balance sheet with solid track record.
Similar Companies
Market Insights

Weekly Picks

Early mover in a fast growing industry. Likely to experience share price volatility as they scale


A case for CA$31.80 (undiluted), aka 8,616% upside from CA$0.37 (an 86 bagger!).


Moderation and Stabilisation: HOLD: Fair Price based on a 4-year Cycle is $12.08
Recently Updated Narratives

A case for USD $14.81 per share based on book value. Be warned, this is a micro-cap dependent on a single mine.

Occidental Petroleum to Become Fairly Priced at $68.29 According to Future Projections

Agfa-Gevaert is a digital and materials turnaround opportunity, with growth potential in ZIRFON, but carrying legacy risks.
Popular Narratives


MicroVision will explode future revenue by 380.37% with a vision towards success


Crazy Undervalued 42 Baggers Silver Play (Active & Running Mine)


