- Switzerland
- /
- Machinery
- /
- SWX:BYS
Bystronic (VTX:BYS) sheds CHF46m, company earnings and investor returns have been trending downwards for past five years


For many, the main point of investing is to generate higher returns than the overall market. But in any portfolio, there will be mixed results between individual stocks. So we wouldn't blame long term Bystronic AG (VTX:BYS) shareholders for doubting their decision to hold, with the stock down 49% over a half decade. The falls have accelerated recently, with the share price down 16% in the last three months.
Given the past week has been tough on shareholders, let's investigate the fundamentals and see what we can learn.
See our latest analysis for Bystronic
SWOT Analysis for Bystronic
- Debt is well covered by earnings.
- Earnings declined over the past year.
- Dividend is low compared to the top 25% of dividend payers in the Machinery market.
- Annual earnings are forecast to grow faster than the Swiss market.
- Trading below our estimate of fair value by more than 20%.
- Debt is not well covered by operating cash flow.
- Paying a dividend but company has no free cash flows.
- Annual revenue is forecast to grow slower than the Swiss market.
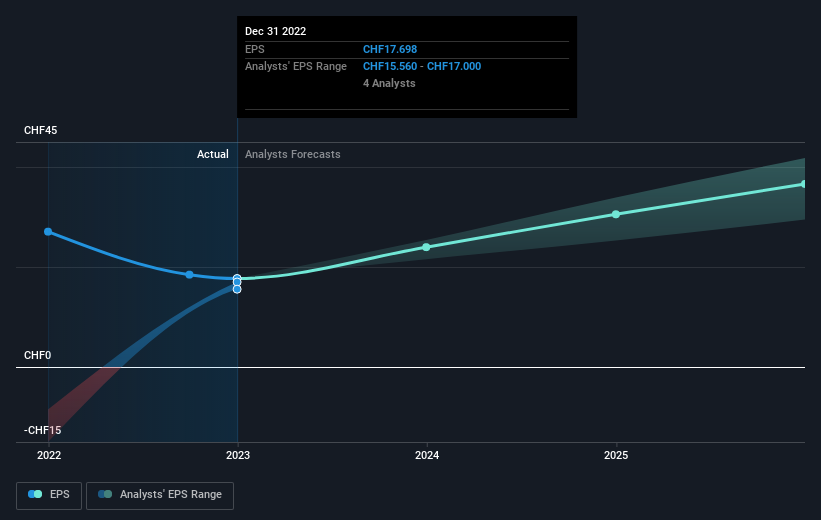
While markets are a powerful pricing mechanism, share prices reflect investor sentiment, not just underlying business performance. One way to examine how market sentiment has changed over time is to look at the interaction between a company's share price and its earnings per share (EPS).
Looking back five years, both Bystronic's share price and EPS declined; the latter at a rate of 15% per year. This fall in the EPS is worse than the 13% compound annual share price fall. So investors might expect EPS to bounce back -- or they may have previously foreseen the EPS decline.
The graphic below depicts how EPS has changed over time (unveil the exact values by clicking on the image).
Dive deeper into Bystronic's key metrics by checking this interactive graph of Bystronic's earnings, revenue and cash flow.
What About Dividends?
As well as measuring the share price return, investors should also consider the total shareholder return (TSR). The TSR is a return calculation that accounts for the value of cash dividends (assuming that any dividend received was reinvested) and the calculated value of any discounted capital raisings and spin-offs. Arguably, the TSR gives a more comprehensive picture of the return generated by a stock. In the case of Bystronic, it has a TSR of -35% for the last 5 years. That exceeds its share price return that we previously mentioned. This is largely a result of its dividend payments!
A Different Perspective
While the broader market gained around 1.1% in the last year, Bystronic shareholders lost 17% (even including dividends). However, keep in mind that even the best stocks will sometimes underperform the market over a twelve month period. Regrettably, last year's performance caps off a bad run, with the shareholders facing a total loss of 6% per year over five years. Generally speaking long term share price weakness can be a bad sign, though contrarian investors might want to research the stock in hope of a turnaround. It's always interesting to track share price performance over the longer term. But to understand Bystronic better, we need to consider many other factors. Even so, be aware that Bystronic is showing 3 warning signs in our investment analysis , and 1 of those makes us a bit uncomfortable...
But note: Bystronic may not be the best stock to buy. So take a peek at this free list of interesting companies with past earnings growth (and further growth forecast).
Please note, the market returns quoted in this article reflect the market weighted average returns of stocks that currently trade on Swiss exchanges.
Valuation is complex, but we're here to simplify it.
Discover if Bystronic might be undervalued or overvalued with our detailed analysis, featuring fair value estimates, potential risks, dividends, insider trades, and its financial condition.
Access Free AnalysisHave feedback on this article? Concerned about the content? Get in touch with us directly. Alternatively, email editorial-team (at) simplywallst.com.
This article by Simply Wall St is general in nature. We provide commentary based on historical data and analyst forecasts only using an unbiased methodology and our articles are not intended to be financial advice. It does not constitute a recommendation to buy or sell any stock, and does not take account of your objectives, or your financial situation. We aim to bring you long-term focused analysis driven by fundamental data. Note that our analysis may not factor in the latest price-sensitive company announcements or qualitative material. Simply Wall St has no position in any stocks mentioned.
About SWX:BYS
Bystronic
Through its subsidiaries, engages in the provision of sheet metal processing solutions for cutting, bending, and automation worldwide.
Flawless balance sheet and good value.
Market Insights

Community Narratives


