
Advertisement

David Iben put it well when he said, 'Volatility is not a risk we care about. What we care about is avoiding the permanent loss of capital.' When we think about how risky a company is, we always like to look at its use of debt, since debt overload can lead to ruin. We can see that Fortis Inc. (TSE:FTS) does use debt in its business. But the real question is whether this debt is making the company risky.
When Is Debt A Problem?
Debt is a tool to help businesses grow, but if a business is incapable of paying off its lenders, then it exists at their mercy. If things get really bad, the lenders can take control of the business. However, a more common (but still painful) scenario is that it has to raise new equity capital at a low price, thus permanently diluting shareholders. By replacing dilution, though, debt can be an extremely good tool for businesses that need capital to invest in growth at high rates of return. When we think about a company's use of debt, we first look at cash and debt together.
View our latest analysis for Fortis
How Much Debt Does Fortis Carry?
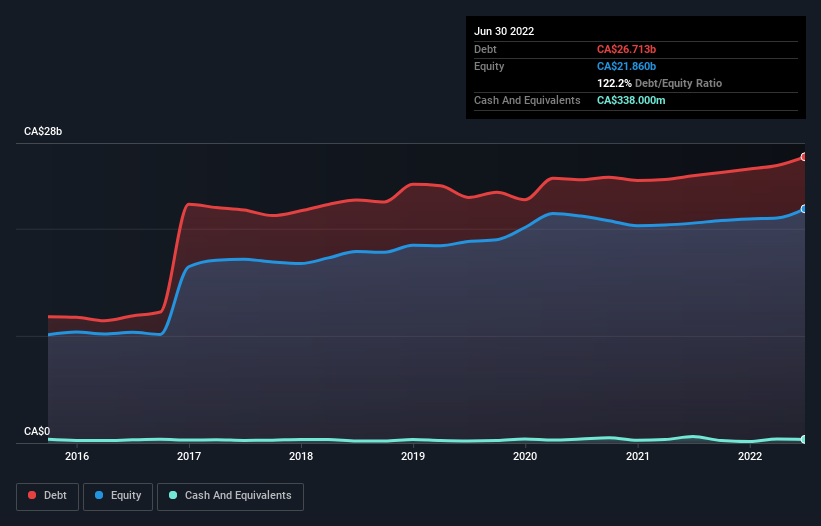
As you can see below, at the end of June 2022, Fortis had CA$26.7b of debt, up from CA$24.9b a year ago. Click the image for more detail. Net debt is about the same, since the it doesn't have much cash.
How Healthy Is Fortis' Balance Sheet?
Zooming in on the latest balance sheet data, we can see that Fortis had liabilities of CA$4.99b due within 12 months and liabilities of CA$33.1b due beyond that. On the other hand, it had cash of CA$338.0m and CA$1.66b worth of receivables due within a year. So its liabilities total CA$36.1b more than the combination of its cash and short-term receivables.
When you consider that this deficiency exceeds the company's huge CA$28.3b market capitalization, you might well be inclined to review the balance sheet intently. In the scenario where the company had to clean up its balance sheet quickly, it seems likely shareholders would suffer extensive dilution.
We use two main ratios to inform us about debt levels relative to earnings. The first is net debt divided by earnings before interest, tax, depreciation, and amortization (EBITDA), while the second is how many times its earnings before interest and tax (EBIT) covers its interest expense (or its interest cover, for short). This way, we consider both the absolute quantum of the debt, as well as the interest rates paid on it.
Weak interest cover of 2.5 times and a disturbingly high net debt to EBITDA ratio of 6.3 hit our confidence in Fortis like a one-two punch to the gut. This means we'd consider it to have a heavy debt load. The good news is that Fortis improved its EBIT by 3.7% over the last twelve months, thus gradually reducing its debt levels relative to its earnings. There's no doubt that we learn most about debt from the balance sheet. But it is future earnings, more than anything, that will determine Fortis's ability to maintain a healthy balance sheet going forward. So if you're focused on the future you can check out this free report showing analyst profit forecasts.
Finally, while the tax-man may adore accounting profits, lenders only accept cold hard cash. So we always check how much of that EBIT is translated into free cash flow. Over the last three years, Fortis saw substantial negative free cash flow, in total. While investors are no doubt expecting a reversal of that situation in due course, it clearly does mean its use of debt is more risky.
Our View
On the face of it, Fortis's net debt to EBITDA left us tentative about the stock, and its conversion of EBIT to free cash flow was no more enticing than the one empty restaurant on the busiest night of the year. But at least its EBIT growth rate is not so bad. We should also note that Electric Utilities industry companies like Fortis commonly do use debt without problems. We're quite clear that we consider Fortis to be really rather risky, as a result of its balance sheet health. So we're almost as wary of this stock as a hungry kitten is about falling into its owner's fish pond: once bitten, twice shy, as they say. The balance sheet is clearly the area to focus on when you are analysing debt. However, not all investment risk resides within the balance sheet - far from it. Be aware that Fortis is showing 2 warning signs in our investment analysis , and 1 of those makes us a bit uncomfortable...
If you're interested in investing in businesses that can grow profits without the burden of debt, then check out this free list of growing businesses that have net cash on the balance sheet.
New: AI Stock Screener & Alerts
Our new AI Stock Screener scans the market every day to uncover opportunities.
• Dividend Powerhouses (3%+ Yield)
• Undervalued Small Caps with Insider Buying
• High growth Tech and AI Companies
Or build your own from over 50 metrics.
Have feedback on this article? Concerned about the content? Get in touch with us directly. Alternatively, email editorial-team (at) simplywallst.com.
This article by Simply Wall St is general in nature. We provide commentary based on historical data and analyst forecasts only using an unbiased methodology and our articles are not intended to be financial advice. It does not constitute a recommendation to buy or sell any stock, and does not take account of your objectives, or your financial situation. We aim to bring you long-term focused analysis driven by fundamental data. Note that our analysis may not factor in the latest price-sensitive company announcements or qualitative material. Simply Wall St has no position in any stocks mentioned.
About TSX:FTS
Fortis
Operates as an electric and gas utility company in Canada, the United States, and the Caribbean countries.
Good value with proven track record and pays a dividend.
Similar Companies
Market Insights


Advertisement
Community Narratives
Nike's Direct-to-Consumer Focus Will Drive Future Growth
Fair Value US$87.90|22.7% undervalued
UN
Community Contributor
Novo Nordisk will dominate GLP-1 market with Ozempic and Wegovy growth
Fair Value US$89.59|14.2% undervalued
BE
Community Contributor
Rheinmetall could get 20-25% of EU-NATO 3%-GDP defence spending
Fair Value €7.57k|82.8% undervalued
NO
Community Contributor