- Canada
- /
- Other Utilities
- /
- TSX:AQN
Calculating The Intrinsic Value Of Algonquin Power & Utilities Corp. (TSE:AQN)

Key Insights
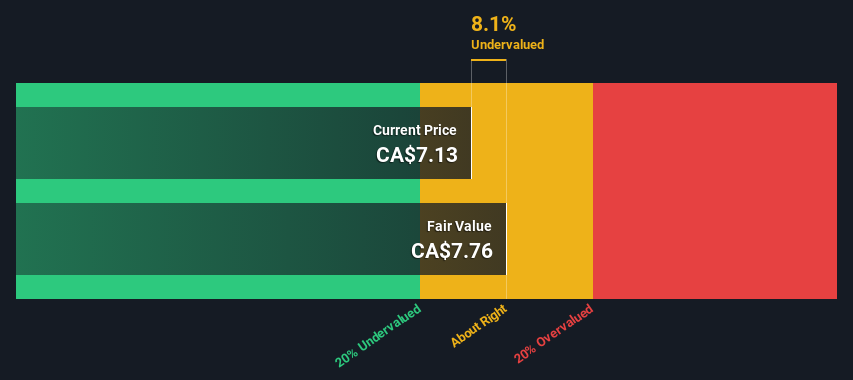
- Using the 2 Stage Free Cash Flow to Equity, Algonquin Power & Utilities fair value estimate is CA$7.76
- Current share price of CA$7.13 suggests Algonquin Power & Utilities is potentially trading close to its fair value
- The US$9.83 analyst price target for AQN is 27% more than our estimate of fair value
In this article we are going to estimate the intrinsic value of Algonquin Power & Utilities Corp. (TSE:AQN) by taking the forecast future cash flows of the company and discounting them back to today's value. This will be done using the Discounted Cash Flow (DCF) model. Believe it or not, it's not too difficult to follow, as you'll see from our example!
We would caution that there are many ways of valuing a company and, like the DCF, each technique has advantages and disadvantages in certain scenarios. Anyone interested in learning a bit more about intrinsic value should have a read of the Simply Wall St analysis model.
See our latest analysis for Algonquin Power & Utilities
Is Algonquin Power & Utilities Fairly Valued?
We are going to use a two-stage DCF model, which, as the name states, takes into account two stages of growth. The first stage is generally a higher growth period which levels off heading towards the terminal value, captured in the second 'steady growth' period. In the first stage we need to estimate the cash flows to the business over the next ten years. Where possible we use analyst estimates, but when these aren't available we extrapolate the previous free cash flow (FCF) from the last estimate or reported value. We assume companies with shrinking free cash flow will slow their rate of shrinkage, and that companies with growing free cash flow will see their growth rate slow, over this period. We do this to reflect that growth tends to slow more in the early years than it does in later years.
Generally we assume that a dollar today is more valuable than a dollar in the future, so we discount the value of these future cash flows to their estimated value in today's dollars:
10-year free cash flow (FCF) forecast
| 2025 | 2026 | 2027 | 2028 | 2029 | 2030 | 2031 | 2032 | 2033 | 2034 | |
| Levered FCF ($, Millions) | US$406.0m | US$168.0m | US$171.0m | US$173.1m | US$175.7m | US$178.7m | US$182.0m | US$185.6m | US$189.3m | US$193.3m |
| Growth Rate Estimate Source | Analyst x1 | Analyst x1 | Analyst x1 | Est @ 1.23% | Est @ 1.51% | Est @ 1.71% | Est @ 1.85% | Est @ 1.95% | Est @ 2.02% | Est @ 2.07% |
| Present Value ($, Millions) Discounted @ 6.0% | US$383 | US$149 | US$144 | US$137 | US$131 | US$126 | US$121 | US$116 | US$112 | US$108 |
("Est" = FCF growth rate estimated by Simply Wall St)
Present Value of 10-year Cash Flow (PVCF) = US$1.5b
We now need to calculate the Terminal Value, which accounts for all the future cash flows after this ten year period. For a number of reasons a very conservative growth rate is used that cannot exceed that of a country's GDP growth. In this case we have used the 5-year average of the 10-year government bond yield (2.2%) to estimate future growth. In the same way as with the 10-year 'growth' period, we discount future cash flows to today's value, using a cost of equity of 6.0%.
Terminal Value (TV)= FCF2034 × (1 + g) ÷ (r – g) = US$193m× (1 + 2.2%) ÷ (6.0%– 2.2%) = US$5.2b
Present Value of Terminal Value (PVTV)= TV / (1 + r)10= US$5.2b÷ ( 1 + 6.0%)10= US$2.9b
The total value is the sum of cash flows for the next ten years plus the discounted terminal value, which results in the Total Equity Value, which in this case is US$4.4b. In the final step we divide the equity value by the number of shares outstanding. Compared to the current share price of CA$7.1, the company appears about fair value at a 8.1% discount to where the stock price trades currently. Remember though, that this is just an approximate valuation, and like any complex formula - garbage in, garbage out.
Important Assumptions
We would point out that the most important inputs to a discounted cash flow are the discount rate and of course the actual cash flows. Part of investing is coming up with your own evaluation of a company's future performance, so try the calculation yourself and check your own assumptions. The DCF also does not consider the possible cyclicality of an industry, or a company's future capital requirements, so it does not give a full picture of a company's potential performance. Given that we are looking at Algonquin Power & Utilities as potential shareholders, the cost of equity is used as the discount rate, rather than the cost of capital (or weighted average cost of capital, WACC) which accounts for debt. In this calculation we've used 6.0%, which is based on a levered beta of 0.929. Beta is a measure of a stock's volatility, compared to the market as a whole. We get our beta from the industry average beta of globally comparable companies, with an imposed limit between 0.8 and 2.0, which is a reasonable range for a stable business.
SWOT Analysis for Algonquin Power & Utilities
- No major strengths identified for AQN.
- Interest payments on debt are not well covered.
- Dividend is low compared to the top 25% of dividend payers in the Integrated Utilities market.
- Shareholders have been diluted in the past year.
- Annual earnings are forecast to grow faster than the Canadian market.
- Good value based on P/E ratio and estimated fair value.
- Debt is not well covered by operating cash flow.
- Dividends are not covered by earnings.
- Annual revenue is forecast to grow slower than the Canadian market.
Looking Ahead:
Valuation is only one side of the coin in terms of building your investment thesis, and it is only one of many factors that you need to assess for a company. It's not possible to obtain a foolproof valuation with a DCF model. Instead the best use for a DCF model is to test certain assumptions and theories to see if they would lead to the company being undervalued or overvalued. For instance, if the terminal value growth rate is adjusted slightly, it can dramatically alter the overall result. For Algonquin Power & Utilities, there are three additional items you should further examine:
- Risks: Take risks, for example - Algonquin Power & Utilities has 4 warning signs (and 2 which are a bit unpleasant) we think you should know about.
- Future Earnings: How does AQN's growth rate compare to its peers and the wider market? Dig deeper into the analyst consensus number for the upcoming years by interacting with our free analyst growth expectation chart.
- Other High Quality Alternatives: Do you like a good all-rounder? Explore our interactive list of high quality stocks to get an idea of what else is out there you may be missing!
PS. The Simply Wall St app conducts a discounted cash flow valuation for every stock on the TSX every day. If you want to find the calculation for other stocks just search here.
The New Payments ETF Is Live on NASDAQ:
Money is moving to real-time rails, and a newly listed ETF now gives investors direct exposure. Fast settlement. Institutional custody. Simple access.
Explore how this launch could reshape portfolios
Sponsored ContentNew: Manage All Your Stock Portfolios in One Place
We've created the ultimate portfolio companion for stock investors, and it's free.
• Connect an unlimited number of Portfolios and see your total in one currency
• Be alerted to new Warning Signs or Risks via email or mobile
• Track the Fair Value of your stocks
Have feedback on this article? Concerned about the content? Get in touch with us directly. Alternatively, email editorial-team (at) simplywallst.com.
This article by Simply Wall St is general in nature. We provide commentary based on historical data and analyst forecasts only using an unbiased methodology and our articles are not intended to be financial advice. It does not constitute a recommendation to buy or sell any stock, and does not take account of your objectives, or your financial situation. We aim to bring you long-term focused analysis driven by fundamental data. Note that our analysis may not factor in the latest price-sensitive company announcements or qualitative material. Simply Wall St has no position in any stocks mentioned.
About TSX:AQN
Algonquin Power & Utilities
Operates in the power and utility industries.
Moderate growth potential with low risk.
Similar Companies
Market Insights

Weekly Picks

THE KINGDOM OF BROWN GOODS: WHY MGPI IS BEING CRUSHED BY INVENTORY & PRIMED FOR RESURRECTION


Why Vertical Aerospace (NYSE: EVTL) is Worth Possibly Over 13x its Current Price


The Quiet Giant That Became AI’s Power Grid
Recently Updated Narratives


A tech powerhouse quietly powering the world’s AI infrastructure.


Keppel DC REIT (SGX: AJBU) is a resilient gem in the data center space.
Why Vertical Aerospace (NYSE: EVTL) is Worth Possibly Over 13x its Current Price
Popular Narratives

MicroVision will explode future revenue by 380.37% with a vision towards success


Crazy Undervalued 42 Baggers Silver Play (Active & Running Mine)


