- Canada
- /
- Telecom Services and Carriers
- /
- TSX:TSAT
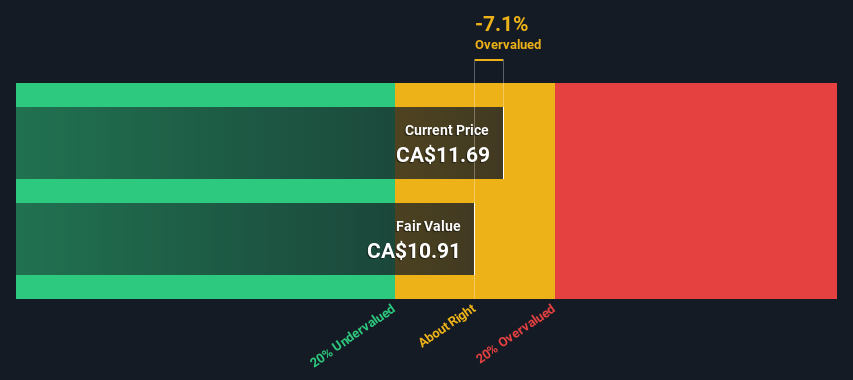
A Look At The Fair Value Of Telesat Corporation (TSE:TSAT)

In this article we are going to estimate the intrinsic value of Telesat Corporation (TSE:TSAT) by estimating the company's future cash flows and discounting them to their present value. The Discounted Cash Flow (DCF) model is the tool we will apply to do this. Before you think you won't be able to understand it, just read on! It's actually much less complex than you'd imagine.
Companies can be valued in a lot of ways, so we would point out that a DCF is not perfect for every situation. Anyone interested in learning a bit more about intrinsic value should have a read of the Simply Wall St analysis model.
Check out our latest analysis for Telesat
Step By Step Through The Calculation
We use what is known as a 2-stage model, which simply means we have two different periods of growth rates for the company's cash flows. Generally the first stage is higher growth, and the second stage is a lower growth phase. In the first stage we need to estimate the cash flows to the business over the next ten years. Seeing as no analyst estimates of free cash flow are available to us, we have extrapolate the previous free cash flow (FCF) from the company's last reported value. We assume companies with shrinking free cash flow will slow their rate of shrinkage, and that companies with growing free cash flow will see their growth rate slow, over this period. We do this to reflect that growth tends to slow more in the early years than it does in later years.
Generally we assume that a dollar today is more valuable than a dollar in the future, so we need to discount the sum of these future cash flows to arrive at a present value estimate:
10-year free cash flow (FCF) estimate
| 2023 | 2024 | 2025 | 2026 | 2027 | 2028 | 2029 | 2030 | 2031 | 2032 | |
| Levered FCF (CA$, Millions) | CA$58.0m | CA$50.1m | CA$45.7m | CA$43.0m | CA$41.5m | CA$40.7m | CA$40.3m | CA$40.2m | CA$40.4m | CA$40.7m |
| Growth Rate Estimate Source | Est @ -19.96% | Est @ -13.48% | Est @ -8.95% | Est @ -5.77% | Est @ -3.55% | Est @ -2% | Est @ -0.91% | Est @ -0.15% | Est @ 0.39% | Est @ 0.76% |
| Present Value (CA$, Millions) Discounted @ 8.8% | CA$53.3 | CA$42.4 | CA$35.5 | CA$30.7 | CA$27.2 | CA$24.5 | CA$22.3 | CA$20.5 | CA$18.9 | CA$17.5 |
("Est" = FCF growth rate estimated by Simply Wall St)
Present Value of 10-year Cash Flow (PVCF) = CA$292m
We now need to calculate the Terminal Value, which accounts for all the future cash flows after this ten year period. The Gordon Growth formula is used to calculate Terminal Value at a future annual growth rate equal to the 5-year average of the 10-year government bond yield of 1.6%. We discount the terminal cash flows to today's value at a cost of equity of 8.8%.
Terminal Value (TV)= FCF2032 × (1 + g) ÷ (r – g) = CA$41m× (1 + 1.6%) ÷ (8.8%– 1.6%) = CA$578m
Present Value of Terminal Value (PVTV)= TV / (1 + r)10= CA$578m÷ ( 1 + 8.8%)10= CA$249m
The total value, or equity value, is then the sum of the present value of the future cash flows, which in this case is CA$541m. To get the intrinsic value per share, we divide this by the total number of shares outstanding. Relative to the current share price of CA$11.7, the company appears around fair value at the time of writing. Valuations are imprecise instruments though, rather like a telescope - move a few degrees and end up in a different galaxy. Do keep this in mind.
The Assumptions
The calculation above is very dependent on two assumptions. The first is the discount rate and the other is the cash flows. You don't have to agree with these inputs, I recommend redoing the calculations yourself and playing with them. The DCF also does not consider the possible cyclicality of an industry, or a company's future capital requirements, so it does not give a full picture of a company's potential performance. Given that we are looking at Telesat as potential shareholders, the cost of equity is used as the discount rate, rather than the cost of capital (or weighted average cost of capital, WACC) which accounts for debt. In this calculation we've used 8.8%, which is based on a levered beta of 1.689. Beta is a measure of a stock's volatility, compared to the market as a whole. We get our beta from the industry average beta of globally comparable companies, with an imposed limit between 0.8 and 2.0, which is a reasonable range for a stable business.
Moving On:
Whilst important, the DCF calculation ideally won't be the sole piece of analysis you scrutinize for a company. DCF models are not the be-all and end-all of investment valuation. Rather it should be seen as a guide to "what assumptions need to be true for this stock to be under/overvalued?" If a company grows at a different rate, or if its cost of equity or risk free rate changes sharply, the output can look very different. For Telesat, we've put together three further aspects you should consider:
- Risks: For example, we've discovered 4 warning signs for Telesat (2 are potentially serious!) that you should be aware of before investing here.
- Other Solid Businesses: Low debt, high returns on equity and good past performance are fundamental to a strong business. Why not explore our interactive list of stocks with solid business fundamentals to see if there are other companies you may not have considered!
- Other Top Analyst Picks: Interested to see what the analysts are thinking? Take a look at our interactive list of analysts' top stock picks to find out what they feel might have an attractive future outlook!
PS. Simply Wall St updates its DCF calculation for every Canadian stock every day, so if you want to find the intrinsic value of any other stock just search here.
Mobile Infrastructure for Defense and Disaster
The next wave in robotics isn't humanoid. Its fully autonomous towers delivering 5G, ISR, and radar in under 30 minutes, anywhere.
Get the investor briefing before the next round of contracts
Sponsored On Behalf of CiTechValuation is complex, but we're here to simplify it.
Discover if Telesat might be undervalued or overvalued with our detailed analysis, featuring fair value estimates, potential risks, dividends, insider trades, and its financial condition.
Access Free AnalysisHave feedback on this article? Concerned about the content? Get in touch with us directly. Alternatively, email editorial-team (at) simplywallst.com.
This article by Simply Wall St is general in nature. We provide commentary based on historical data and analyst forecasts only using an unbiased methodology and our articles are not intended to be financial advice. It does not constitute a recommendation to buy or sell any stock, and does not take account of your objectives, or your financial situation. We aim to bring you long-term focused analysis driven by fundamental data. Note that our analysis may not factor in the latest price-sensitive company announcements or qualitative material. Simply Wall St has no position in any stocks mentioned.
About TSX:TSAT
Telesat
A satellite operator, provides mission-critical communications solutions to support the requirements of satellite users in Canada, the United States, Asia, Australia, Latin America, the Caribbean, Europe, the Middle East, and Africa.
Limited growth with imperfect balance sheet.
Similar Companies
Market Insights

Weekly Picks

THE KINGDOM OF BROWN GOODS: WHY MGPI IS BEING CRUSHED BY INVENTORY & PRIMED FOR RESURRECTION


Why Vertical Aerospace (NYSE: EVTL) is Worth Possibly Over 13x its Current Price


The Quiet Giant That Became AI’s Power Grid
Recently Updated Narratives


Fiverr International will transform the freelance industry with AI-powered growth

Jackson Financial Stock: When Insurance Math Meets a Shifting Claims Landscape

Stride Stock: Online Education Finds Its Second Act
Popular Narratives


MicroVision will explode future revenue by 380.37% with a vision towards success


Crazy Undervalued 42 Baggers Silver Play (Active & Running Mine)


