Advertisement
Is Celestica’s Valuation Stretched After Stunning 3,400% Five-Year Rally?

Simply Wall St
Reviewed by Bailey Pemberton
If you are checking in on Celestica stock and wondering whether now is the right time to buy, sell, or just watch, you are in good company. With so much excitement around its staggering climb, even seasoned investors are pausing to reassess. Celestica has delivered jaw-dropping performance, with the stock up 147.3% year-to-date and an incredible 336.6% over the last twelve months. Zoom out even further, and the numbers feel almost unreal: 2,716.1% in the past three years and a massive 3,474.0% return across five. That kind of run easily catches the market’s attention, shifting perceptions of growth potential and risk almost overnight.
Yet, it has not been all smooth sailing lately. Over the past week and month, the stock has cooled off just a bit, logging returns of -3.1% and -1.3% respectively. While those numbers may seem minor in the context of its multi-year surge, they do hint at some recalibration among investors. Much of the recent activity has been supported by broader market enthusiasm for tech manufacturing and nearshoring trends. These are areas where Celestica has been making headlines for operational expansion and new contract wins.
But momentum only gets you so far, and the ultimate question is how Celestica stacks up on valuation right now. Our current valuation score for the company is 0 out of 6, meaning none of our standard undervaluation checks are in its favor. So, what do different valuation methods say, and is there an even smarter way to think about this stock’s true value? Let’s break down the classic approaches and discover if there’s a better lens you should try at the end.
Celestica scores just 0/6 on our valuation checks. See what other red flags we found in the full valuation breakdown.
Approach 1: Celestica Discounted Cash Flow (DCF) Analysis
The Discounted Cash Flow (DCF) model estimates a company’s intrinsic value by projecting its future cash flows and discounting them to today’s dollars. This method is popular for assessing what a business is truly worth, independent of short-term market swings, by focusing squarely on the company’s ability to generate cash over time.
For Celestica, the latest reported Free Cash Flow stands at $378.6 million. Analysts forecast free cash flow growth over the next several years, with projections reaching $807.4 million in 2027 before adjusting downward to $487 million by 2028. Projections for years beyond 2028 are based on lower-growth estimates, with extrapolated figures provided by Simply Wall St. In 2035, for example, estimated free cash flow dips to about $188.2 million.
Applying the DCF approach, Celestica’s intrinsic value per share is calculated at $55.12. When compared to the current market price, the stock appears to be trading at a premium. Specifically, it is estimated to be 502.3% over its DCF fair value. This suggests the market is factoring in extremely optimistic assumptions about Celestica’s future growth and profitability.
Result: OVERVALUED
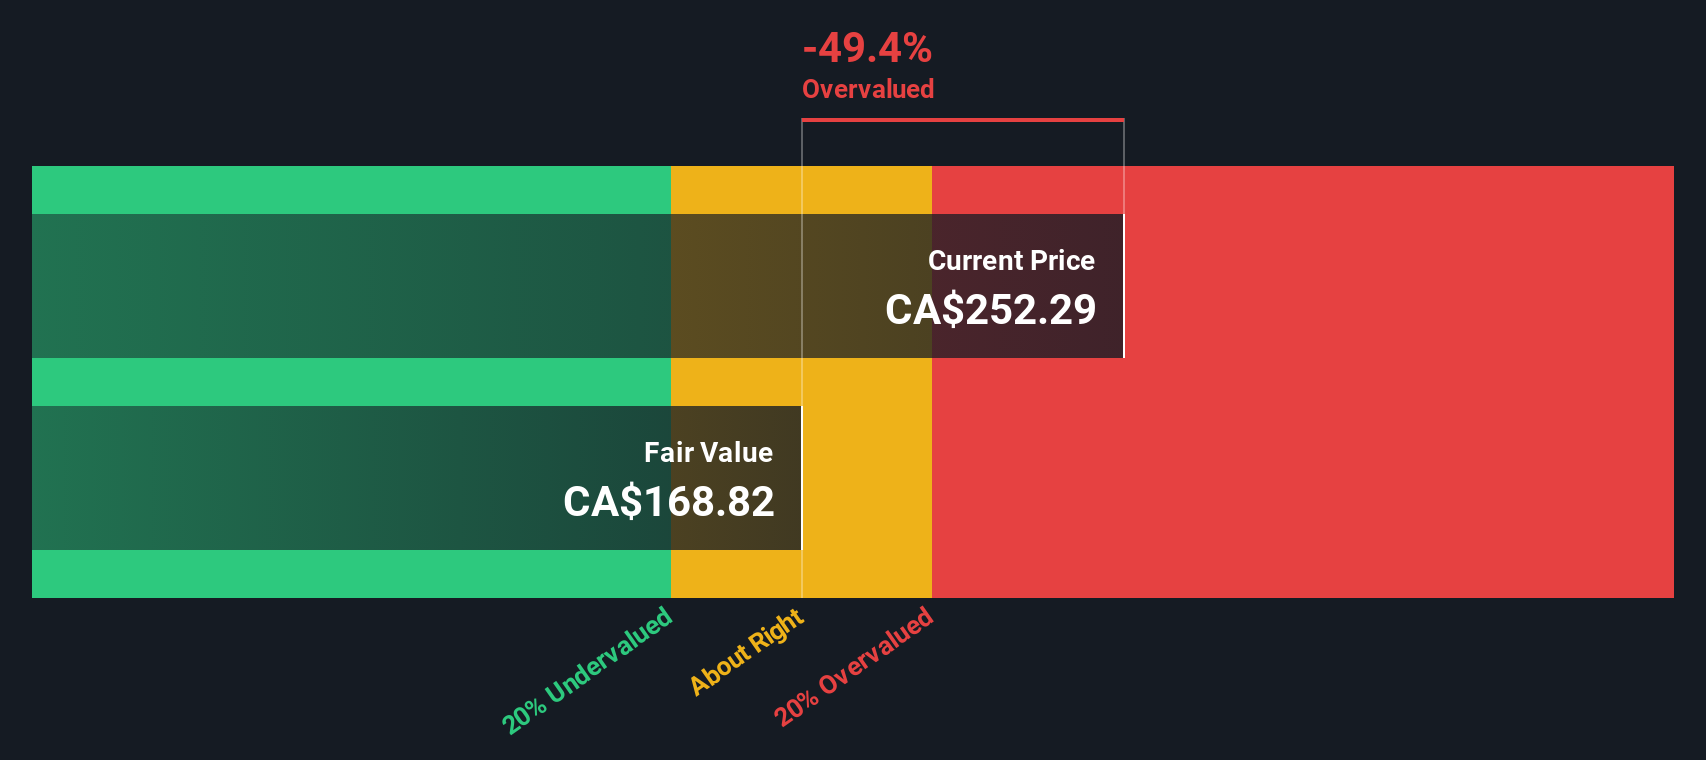
Our Discounted Cash Flow (DCF) analysis suggests Celestica may be overvalued by 502.3%. Find undervalued stocks or create your own screener to find better value opportunities.
Approach 2: Celestica Price vs Earnings (P/E)
The Price-to-Earnings (P/E) ratio is a widely used valuation tool for profitable companies like Celestica because it directly connects a company's current share price to its underlying earnings. For investors, the P/E ratio offers a quick way to gauge how much the market is willing to pay for each dollar of earnings, which is particularly relevant for businesses generating consistent profits.
That said, a “normal” or “fair” P/E ratio can vary significantly across companies and industries, shaped by growth expectations and perceived risk. Investors typically pay a higher P/E for businesses with strong growth prospects and lower risk, while more mature or volatile companies tend to trade at lower multiples.
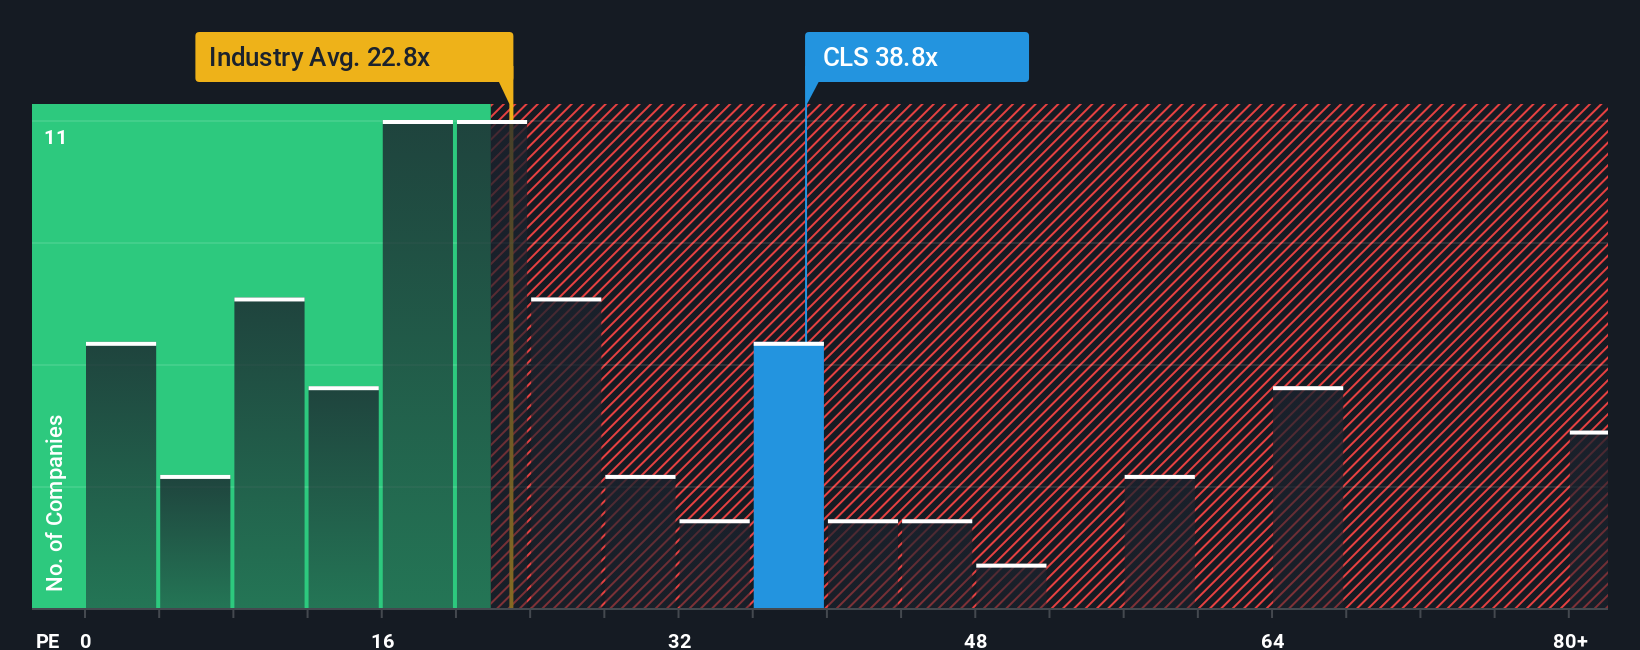
Celestica currently trades at a lofty P/E of 50.8x. To put this into context, the average for peers is 29.5x, and the Electronic industry average sits at 27.4x. Clearly, the market is pricing in expectations of higher growth or lower risk for Celestica compared to its industry and peer set.
Simply Wall St’s proprietary “Fair Ratio” for Celestica is 49.2x. This figure goes beyond simply measuring against peers or sector averages, as it incorporates the company’s growth, profitability, risk profile, market cap, and broader sector dynamics. By capturing these nuances, the Fair Ratio gives a more tailored reference point for valuation than broad benchmarks alone.
Comparing the Fair Ratio and Celestica’s actual P/E, the difference is razor thin, signaling that today’s lofty multiple is justified given the company’s profile and outlook.
Result: ABOUT RIGHT
PE ratios tell one story, but what if the real opportunity lies elsewhere? Discover companies where insiders are betting big on explosive growth.
Upgrade Your Decision Making: Choose your Celestica Narrative
Earlier we mentioned that there is an even better way to understand valuation, so let’s introduce you to Narratives. A Narrative is simply your own story, a perspective about a company’s future, including what you believe its fair value should be and your estimates for key numbers like revenue, earnings, or profit margins. Narratives connect the qualitative “why” behind Celestica’s business and industry outlook with a financial forecast, allowing you to translate your beliefs into a single, actionable fair value.
On Simply Wall St’s Community page, Narratives are easy and accessible for everyone to build and explore. Used by millions of investors, they can help decide when to buy or sell by comparing your Fair Value to the current Price. Narratives update automatically with every earnings report, industry development, or news story, so your thinking stays fresh and relevant each time new information arrives.
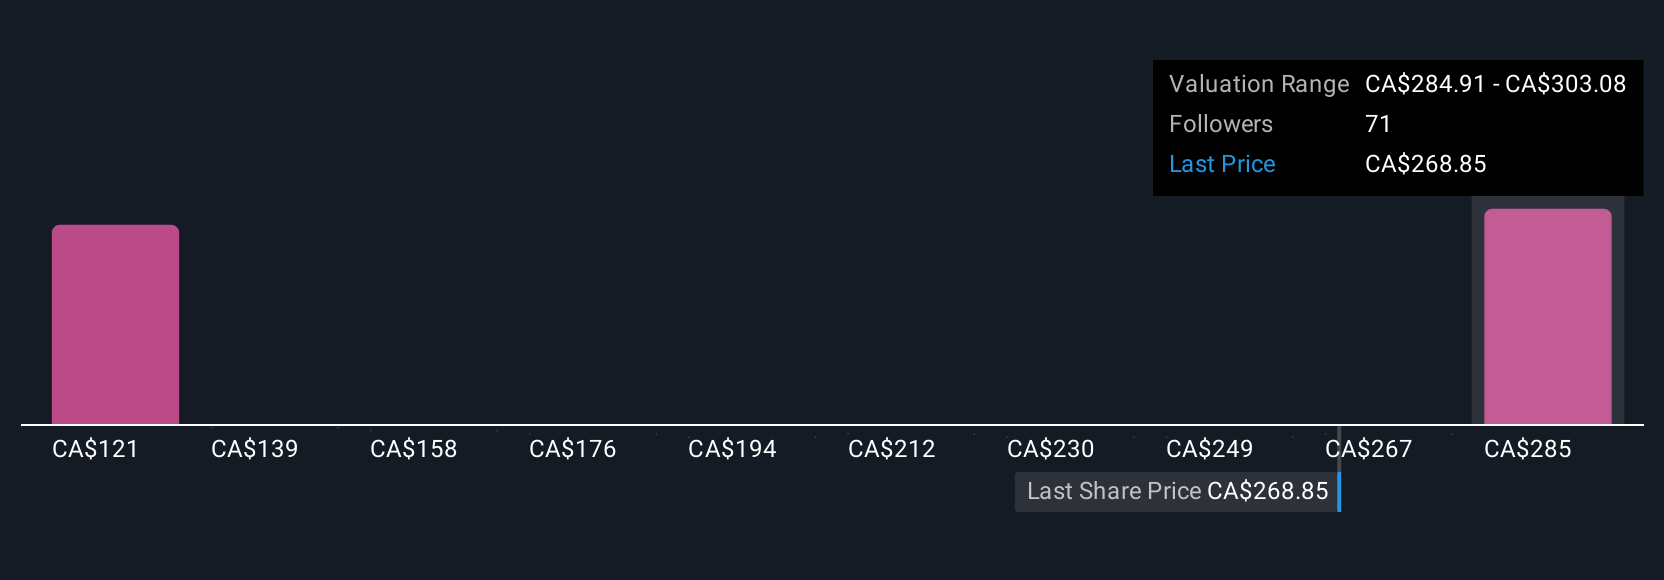
For Celestica, for example, some investors’ narratives expect robust AI and regional manufacturing growth for a future fair value as high as CA$362.34, while others, more cautious about hyperscaler dependency, estimate fair value closer to CA$188.2. Narratives let you see, share, and compare those perspectives, helping you make more confident, personalized investing choices.
Do you think there's more to the story for Celestica? Create your own Narrative to let the Community know!
This article by Simply Wall St is general in nature. We provide commentary based on historical data and analyst forecasts only using an unbiased methodology and our articles are not intended to be financial advice. It does not constitute a recommendation to buy or sell any stock, and does not take account of your objectives, or your financial situation. We aim to bring you long-term focused analysis driven by fundamental data. Note that our analysis may not factor in the latest price-sensitive company announcements or qualitative material. Simply Wall St has no position in any stocks mentioned.
New: AI Stock Screener & Alerts
Our new AI Stock Screener scans the market every day to uncover opportunities.
• Dividend Powerhouses (3%+ Yield)
• Undervalued Small Caps with Insider Buying
• High growth Tech and AI Companies
Or build your own from over 50 metrics.
Have feedback on this article? Concerned about the content? Get in touch with us directly. Alternatively, email editorial-team@simplywallst.com
About TSX:CLS
Celestica
Provides supply chain solutions in Asia, North America, and internationally.
Outstanding track record with high growth potential.
Similar Companies
Market Insights

Advertisement
Community Narratives
A formidable player in AI and enterprise computing.
Fair Value US$210.00|12.2% overvalued
CO
Community Contributor
IREN's Bold Moves in Sustainable Bitcoin Mining & AI Data Centers
Fair Value US$72.52|17.1% undervalued
BL
Community Contributor
Cooling the Champions: The Aussie Tech Behind F1's Victories
Fair Value AU$12.40|38.1% undervalued
TR
Community Contributor