
Advertisement
An Intrinsic Calculation For Celestica Inc. (TSE:CLS) Suggests It's 27% Undervalued

Key Insights
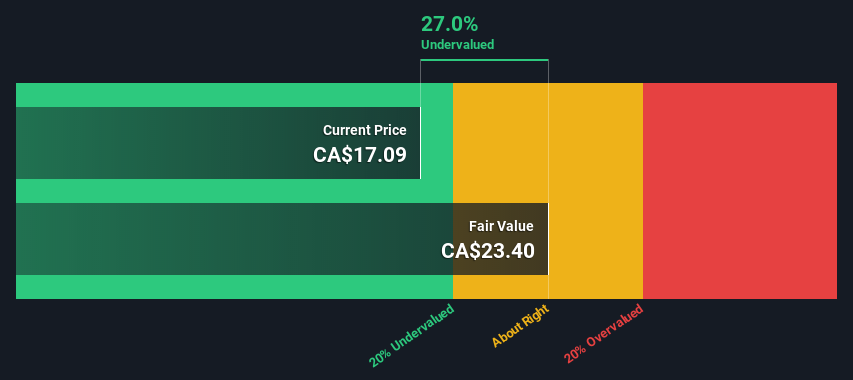
- Celestica's estimated fair value is US$23.4 based on 2 Stage Free Cash Flow to Equity
- Current share price of US$17.1 suggests Celestica is 27% undervalued
- Analyst price target for CLS is which is 100% below our fair value estimate
In this article we are going to estimate the intrinsic value of Celestica Inc. (TSE:CLS) by taking the forecast future cash flows of the company and discounting them back to today's value. This will be done using the Discounted Cash Flow (DCF) model. Before you think you won't be able to understand it, just read on! It's actually much less complex than you'd imagine.
Remember though, that there are many ways to estimate a company's value, and a DCF is just one method. Anyone interested in learning a bit more about intrinsic value should have a read of the Simply Wall St analysis model.
See our latest analysis for Celestica
Crunching The Numbers
We're using the 2-stage growth model, which simply means we take in account two stages of company's growth. In the initial period the company may have a higher growth rate and the second stage is usually assumed to have a stable growth rate. To start off with, we need to estimate the next ten years of cash flows. Where possible we use analyst estimates, but when these aren't available we extrapolate the previous free cash flow (FCF) from the last estimate or reported value. We assume companies with shrinking free cash flow will slow their rate of shrinkage, and that companies with growing free cash flow will see their growth rate slow, over this period. We do this to reflect that growth tends to slow more in the early years than it does in later years.
A DCF is all about the idea that a dollar in the future is less valuable than a dollar today, and so the sum of these future cash flows is then discounted to today's value:
10-year free cash flow (FCF) forecast
| 2023 | 2024 | 2025 | 2026 | 2027 | 2028 | 2029 | 2030 | 2031 | 2032 | |
| Levered FCF ($, Millions) | US$162.1m | US$180.0m | US$181.0m | US$182.6m | US$184.7m | US$187.1m | US$189.7m | US$192.6m | US$195.6m | US$198.7m |
| Growth Rate Estimate Source | Analyst x3 | Analyst x2 | Est @ 0.56% | Est @ 0.90% | Est @ 1.13% | Est @ 1.30% | Est @ 1.42% | Est @ 1.50% | Est @ 1.56% | Est @ 1.60% |
| Present Value ($, Millions) Discounted @ 9.8% | US$148 | US$149 | US$137 | US$126 | US$116 | US$107 | US$98.9 | US$91.5 | US$84.7 | US$78.4 |
("Est" = FCF growth rate estimated by Simply Wall St)
Present Value of 10-year Cash Flow (PVCF) = US$1.1b
After calculating the present value of future cash flows in the initial 10-year period, we need to calculate the Terminal Value, which accounts for all future cash flows beyond the first stage. For a number of reasons a very conservative growth rate is used that cannot exceed that of a country's GDP growth. In this case we have used the 5-year average of the 10-year government bond yield (1.7%) to estimate future growth. In the same way as with the 10-year 'growth' period, we discount future cash flows to today's value, using a cost of equity of 9.8%.
Terminal Value (TV)= FCF2032 × (1 + g) ÷ (r – g) = US$199m× (1 + 1.7%) ÷ (9.8%– 1.7%) = US$2.5b
Present Value of Terminal Value (PVTV)= TV / (1 + r)10= US$2.5b÷ ( 1 + 9.8%)10= US$989m
The total value is the sum of cash flows for the next ten years plus the discounted terminal value, which results in the Total Equity Value, which in this case is US$2.1b. In the final step we divide the equity value by the number of shares outstanding. Relative to the current share price of CA$17.1, the company appears a touch undervalued at a 27% discount to where the stock price trades currently. The assumptions in any calculation have a big impact on the valuation, so it is better to view this as a rough estimate, not precise down to the last cent.
The Assumptions
We would point out that the most important inputs to a discounted cash flow are the discount rate and of course the actual cash flows. If you don't agree with these result, have a go at the calculation yourself and play with the assumptions. The DCF also does not consider the possible cyclicality of an industry, or a company's future capital requirements, so it does not give a full picture of a company's potential performance. Given that we are looking at Celestica as potential shareholders, the cost of equity is used as the discount rate, rather than the cost of capital (or weighted average cost of capital, WACC) which accounts for debt. In this calculation we've used 9.8%, which is based on a levered beta of 1.341. Beta is a measure of a stock's volatility, compared to the market as a whole. We get our beta from the industry average beta of globally comparable companies, with an imposed limit between 0.8 and 2.0, which is a reasonable range for a stable business.
SWOT Analysis for Celestica
Strength
- Earnings growth over the past year exceeded the industry.
- Debt is not viewed as a risk.
Weakness
- No major weaknesses identified for CLS.
Opportunity
- Annual earnings are forecast to grow faster than the Canadian market.
- Good value based on P/E ratio and estimated fair value.
Threat
- Annual revenue is forecast to grow slower than the Canadian market.
Moving On:
Valuation is only one side of the coin in terms of building your investment thesis, and it shouldn't be the only metric you look at when researching a company. The DCF model is not a perfect stock valuation tool. Rather it should be seen as a guide to "what assumptions need to be true for this stock to be under/overvalued?" If a company grows at a different rate, or if its cost of equity or risk free rate changes sharply, the output can look very different. Can we work out why the company is trading at a discount to intrinsic value? For Celestica, there are three further elements you should explore:
- Risks: For example, we've discovered 1 warning sign for Celestica that you should be aware of before investing here.
- Management:Have insiders been ramping up their shares to take advantage of the market's sentiment for CLS's future outlook? Check out our management and board analysis with insights on CEO compensation and governance factors.
- Other High Quality Alternatives: Do you like a good all-rounder? Explore our interactive list of high quality stocks to get an idea of what else is out there you may be missing!
PS. Simply Wall St updates its DCF calculation for every Canadian stock every day, so if you want to find the intrinsic value of any other stock just search here.
New: AI Stock Screener & Alerts
Our new AI Stock Screener scans the market every day to uncover opportunities.
• Dividend Powerhouses (3%+ Yield)
• Undervalued Small Caps with Insider Buying
• High growth Tech and AI Companies
Or build your own from over 50 metrics.
Have feedback on this article? Concerned about the content? Get in touch with us directly. Alternatively, email editorial-team (at) simplywallst.com.
This article by Simply Wall St is general in nature. We provide commentary based on historical data and analyst forecasts only using an unbiased methodology and our articles are not intended to be financial advice. It does not constitute a recommendation to buy or sell any stock, and does not take account of your objectives, or your financial situation. We aim to bring you long-term focused analysis driven by fundamental data. Note that our analysis may not factor in the latest price-sensitive company announcements or qualitative material. Simply Wall St has no position in any stocks mentioned.
About TSX:CLS
Celestica
Provides supply chain solutions in North America, Europe, and Asia.
Outstanding track record with flawless balance sheet.
Similar Companies
Market Insights


Advertisement
Community Narratives
Rocket Lab USA Will Ignite a 30% Revenue Growth Journey
Fair Value US$31.72|41.9% undervalued
KI
Community Contributor
EasyJet weirdly unloved by investors in spite of relatively attractive metrics
Fair Value UK£6.95|31.9% undervalued
PI
Community Contributor
HEXPOL AB: Sustained Long Term Growth, Stable Margins, and Strategic M&A
Fair Value SEK 122.27|24.9% undervalued
MA
Community Contributor