
Advertisement
Not Many Are Piling Into Intermap Technologies Corporation (TSE:IMP) Just Yet
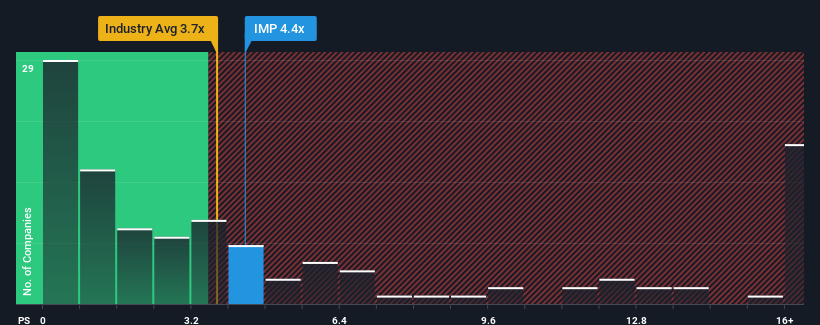
It's not a stretch to say that Intermap Technologies Corporation's (TSE:IMP) price-to-sales (or "P/S") ratio of 4.4x right now seems quite "middle-of-the-road" for companies in the Software industry in Canada, where the median P/S ratio is around 3.7x. Although, it's not wise to simply ignore the P/S without explanation as investors may be disregarding a distinct opportunity or a costly mistake.
See our latest analysis for Intermap Technologies
How Has Intermap Technologies Performed Recently?
With revenue growth that's exceedingly strong of late, Intermap Technologies has been doing very well. It might be that many expect the strong revenue performance to wane, which has kept the share price, and thus the P/S ratio, from rising. If that doesn't eventuate, then existing shareholders have reason to be feeling optimistic about the future direction of the share price.
We don't have analyst forecasts, but you can see how recent trends are setting up the company for the future by checking out our free report on Intermap Technologies' earnings, revenue and cash flow.How Is Intermap Technologies' Revenue Growth Trending?
There's an inherent assumption that a company should be matching the industry for P/S ratios like Intermap Technologies' to be considered reasonable.
If we review the last year of revenue growth, the company posted a terrific increase of 85%. Pleasingly, revenue has also lifted 163% in aggregate from three years ago, thanks to the last 12 months of growth. So we can start by confirming that the company has done a great job of growing revenue over that time.
This is in contrast to the rest of the industry, which is expected to grow by 19% over the next year, materially lower than the company's recent medium-term annualised growth rates.
In light of this, it's curious that Intermap Technologies' P/S sits in line with the majority of other companies. Apparently some shareholders believe the recent performance is at its limits and have been accepting lower selling prices.
What We Can Learn From Intermap Technologies' P/S?
We'd say the price-to-sales ratio's power isn't primarily as a valuation instrument but rather to gauge current investor sentiment and future expectations.
To our surprise, Intermap Technologies revealed its three-year revenue trends aren't contributing to its P/S as much as we would have predicted, given they look better than current industry expectations. There could be some unobserved threats to revenue preventing the P/S ratio from matching this positive performance. At least the risk of a price drop looks to be subdued if recent medium-term revenue trends continue, but investors seem to think future revenue could see some volatility.
Having said that, be aware Intermap Technologies is showing 4 warning signs in our investment analysis, and 2 of those don't sit too well with us.
If you're unsure about the strength of Intermap Technologies' business, why not explore our interactive list of stocks with solid business fundamentals for some other companies you may have missed.
New: AI Stock Screener & Alerts
Our new AI Stock Screener scans the market every day to uncover opportunities.
• Dividend Powerhouses (3%+ Yield)
• Undervalued Small Caps with Insider Buying
• High growth Tech and AI Companies
Or build your own from over 50 metrics.
Have feedback on this article? Concerned about the content? Get in touch with us directly. Alternatively, email editorial-team (at) simplywallst.com.
This article by Simply Wall St is general in nature. We provide commentary based on historical data and analyst forecasts only using an unbiased methodology and our articles are not intended to be financial advice. It does not constitute a recommendation to buy or sell any stock, and does not take account of your objectives, or your financial situation. We aim to bring you long-term focused analysis driven by fundamental data. Note that our analysis may not factor in the latest price-sensitive company announcements or qualitative material. Simply Wall St has no position in any stocks mentioned.
MI

The Foxhole
Nvidia's (NVDA) record profit had a US$7.8 billion catch. That chunk came from betting on its own customers, not from selling its chips.
137
JA

Jake_Merritt
The circularity worth examining is not the mark-to-market line. A large and growing share of Nvidia's revenue comes from companies funded by venture capital, and Nvidia participates in some of those rounds. That is the loop. The paper gains are just an accounting reflection of it, so focusing on them means arguing about the mirror rather than the room.
NA
nadia_y3d8i
Hyperscalers grew 13% sequentially, the other AI segment grew 25% and 138% year on year. The faster half is the funded half. AI venture funding was over 400 billion in the first half with about 70% spent on compute. That is an interesting composition shift like I mentioned yesterday.
 Andrew Legget
Market Insights
Great earnings season, but are the earnings real?

At first glance, this was the strongest earnings season in years. But when you look at where the growth actually came from, the story splits into two very different pictures.
00
About TSX:IMP
Intermap Technologies
A geospatial intelligence company, provides various geospatial solutions and analytics in the United States, the Asia Pacific, and Europe.
Flawless balance sheet with high growth potential.
Similar Companies
Market Insights


Advertisement
Weekly Picks
LO


Lou_Basenese on Oncolytics Biotech ·
The Team Behind a $2 Billion Johnson & Johnson (JNJ) Deal Just Took Over This $105 Million Cancer Biotech
Fair Value:US$3.575.7% undervalued
22 followersusers have followed this narrative
0 commentsusers have commented on this narrative
7 likesusers have liked this narrative
TR


tripledub on Meta Platforms ·
The $135 Billion Bet That Should Make Every Shareholder Nervous
Fair Value:US$5862.5% undervalued
57 followersusers have followed this narrative
3 commentsusers have commented on this narrative
34 likesusers have liked this narrative
TA


Talos on Voyager Technologies ·
The "Landlord of Orbit" – A Deep Value Play Ahead of the Starlab Era
Fair Value:US$385.291.0% undervalued
55 followersusers have followed this narrative
0 commentsusers have commented on this narrative
6 likesusers have liked this narrative
IV

Ivoed on Uber Technologies ·
Uber’s Valuation Depends On Who Captures The Economics Of Driverless Rides
Fair Value:US$11633.7% undervalued
12 followersusers have followed this narrative
0 commentsusers have commented on this narrative
3 likesusers have liked this narrative
Recently Updated Narratives
SA


SashaJ on Astera Labs ·
Astera Labs - A Great Story But At What Price
Fair Value:US$335.829.4% undervalued
1 followerusers have followed this narrative
0 commentsusers have commented on this narrative
0 likesusers have liked this narrative
RI


Ricardinho on Southern Cross Electrical Engineering ·
Southern Cross Electrical Engineering (ASX: SXE): A Long-Duration Opportunity, With Near-Term Noise
Fair Value:AU$4.0710.6% overvalued
6 followersusers have followed this narrative
1 commentusers have commented on this narrative
0 likesusers have liked this narrative
ES

Ester on Sorento Capital Berhad ·
Sorento Capital Berhad: Earnings Strengthened by Margin Expansion and Cost Discipline
Fair Value:RM 0.8826.1% undervalued
1 followerusers have followed this narrative
0 commentsusers have commented on this narrative
0 likesusers have liked this narrative
Popular Narratives
OS


oscargarcia on NVIDIA ·
The company that went from selling GPUs to gamers to becoming the AI arms dealer of the 21st century.
Fair Value:US$28018.6% undervalued
366 followersusers have followed this narrative
9 commentsusers have commented on this narrative
16 likesusers have liked this narrative
CU

CubanEros on Microsoft ·
A wonderful business at reasonable price.
Fair Value:US$419.9120.3% overvalued
213 followersusers have followed this narrative
0 commentsusers have commented on this narrative
9 likesusers have liked this narrative
KI

KiwiInvest on Amazon.com ·
Amazon's high growth, high tech segments propel its profits, while traditional segments plod along
Fair Value:US$475.0946.1% undervalued
236 followersusers have followed this narrative
1 commentusers have commented on this narrative
8 likesusers have liked this narrative


