Advertisement
- Canada
- /
- Real Estate
- /
- TSX:CIGI
How Should Investors View Colliers After Its 8% Slide and New Property Launch in 2025?

Simply Wall St
Reviewed by Bailey Pemberton
Wondering whether Colliers International Group is a buy, hold, or sell? You are definitely not alone. This stock tends to catch the eye of both growth seekers and value investors, and its recent performance is enough to spark debate. After all, Colliers has delivered some impressive gains over the long haul, up 138.0% over the last five years and 67.1% over the past three years. More recently, things have cooled a bit, with a 1.6% dip over the last week and an 8.3% slide through the past month, despite being up 9.1% for the year.
Some see that as a red flag, others as a much-needed reset after a strong run. Changing economic conditions in the commercial real estate sector are certainly influencing how investors size up Colliers. Risk appetites have shifted as interest rates, global supply chains, and demand for office space evolve. While that makes headlines, what really matters for long-term investors is value.
Here is where things get interesting. Using six commonly referenced valuation checks, Colliers comes up with a score of just 0, meaning it is not undervalued on any of these measures. Naturally, that might surprise those who look at its track record and market position. So, how exactly is Colliers being valued today? Let’s break down the most commonly used approaches, and by the end, I will show you a perspective on valuation that goes beyond the numbers most investors watch.
Colliers International Group scores just 0/6 on our valuation checks. See what other red flags we found in the full valuation breakdown.
Approach 1: Colliers International Group Discounted Cash Flow (DCF) Analysis
A Discounted Cash Flow (DCF) model estimates a company’s intrinsic value by projecting its future cash flows and discounting them back to today’s dollars using a required rate of return. This approach aims to capture the company’s true worth based on expected future performance, rather than just current market sentiment.
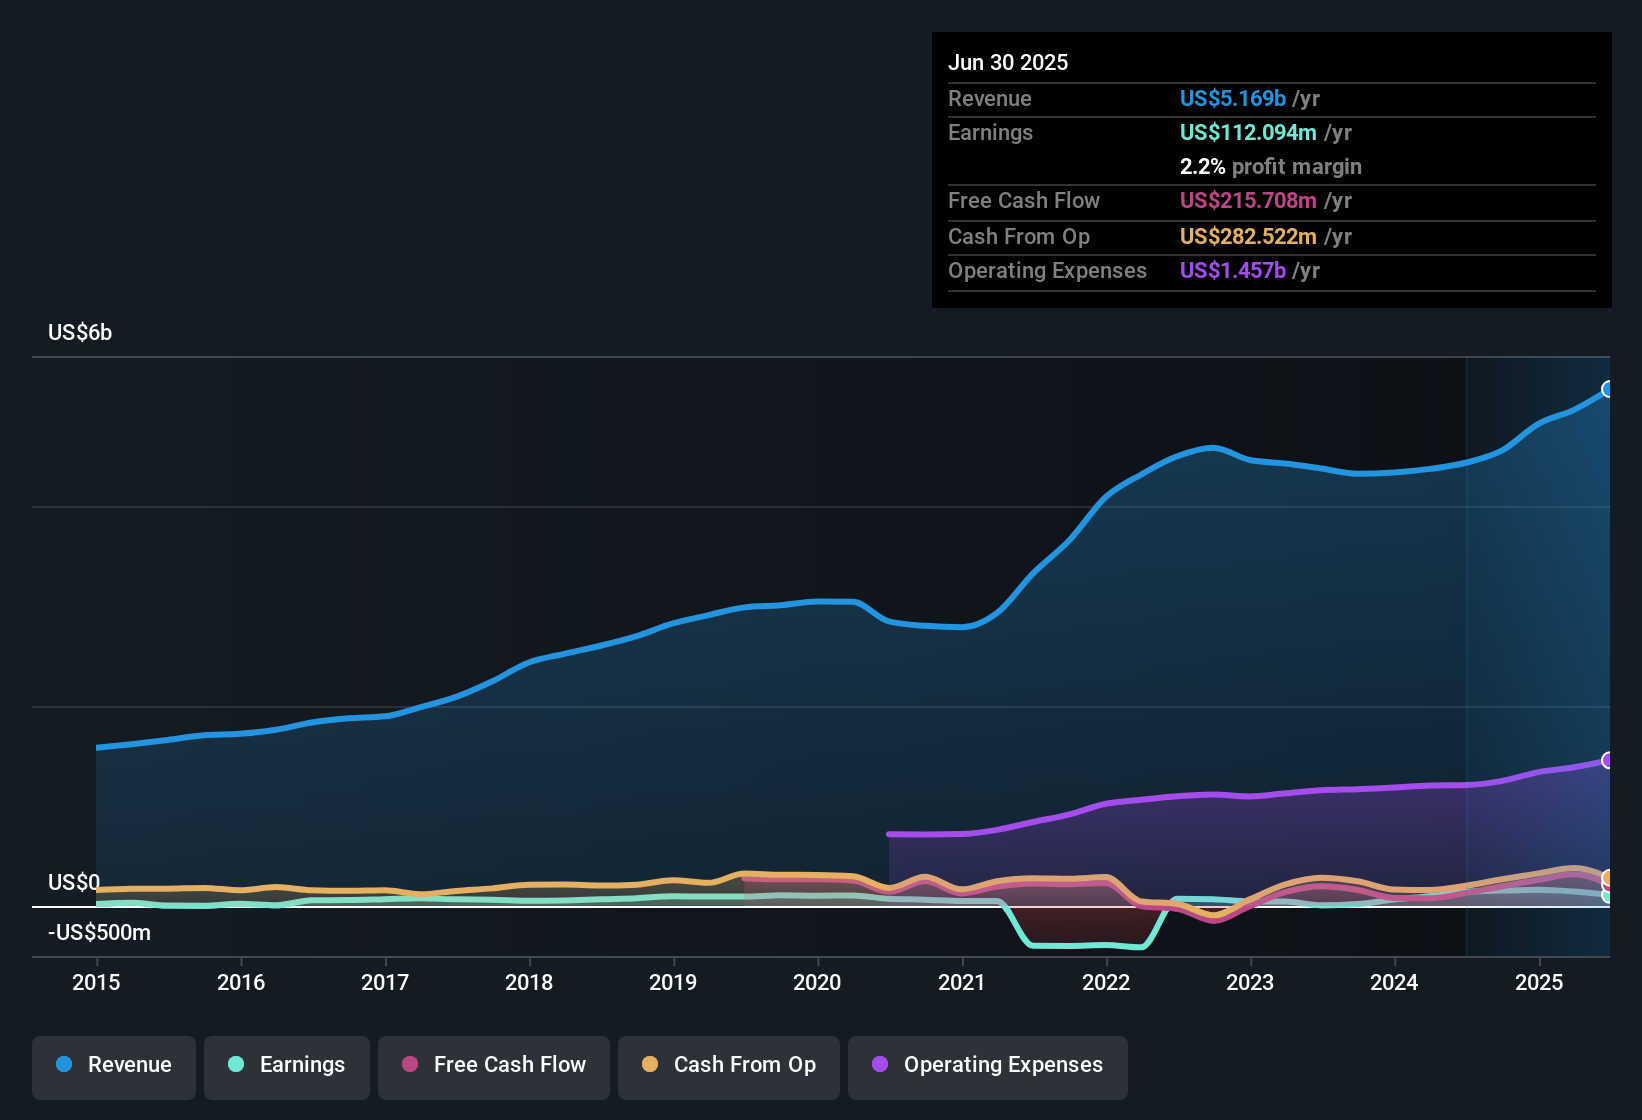
For Colliers International Group, the latest free cash flow (FCF) reported is $199.3 million. While analyst estimates only span the next few years, Simply Wall St extrapolates further out and suggests FCF could reach approximately $429 million by 2035. Cash flow is projected to rise steadily, with the 2027 estimate at $386 million and a ten-year forecast showing year-on-year increases. However, growth rates appear to moderate over time. All figures are provided in US dollars.
Taking these projected cash flows and discounting them based on the company’s risk profile, the DCF model arrives at an intrinsic value of $170.17 per share. With the current share price standing about 24.1% above this calculated fair value, the DCF model indicates Colliers is fundamentally overvalued at present.
Result: OVERVALUED
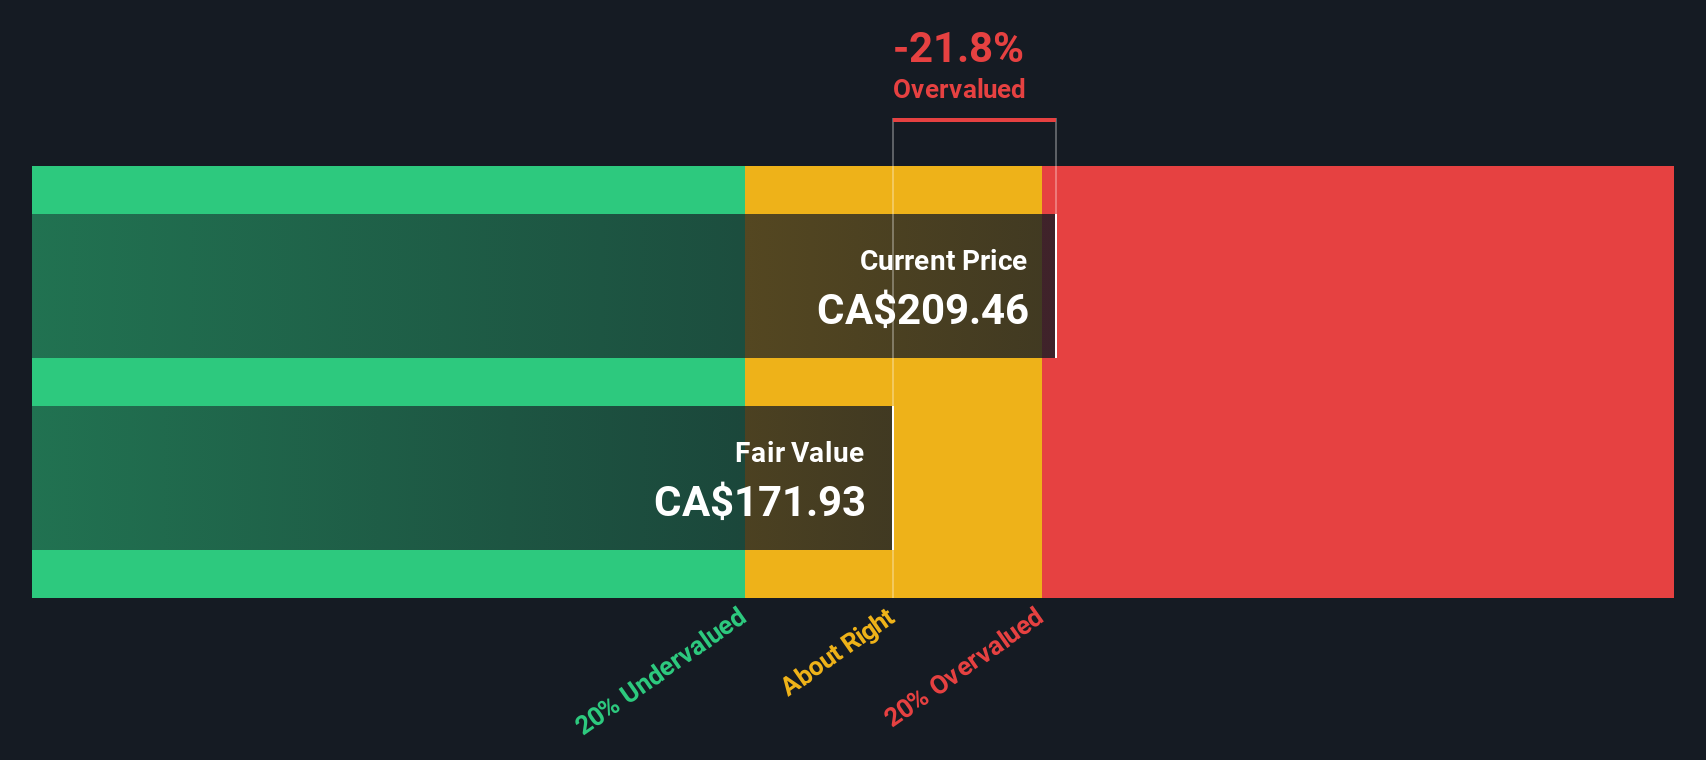
Our Discounted Cash Flow (DCF) analysis suggests Colliers International Group may be overvalued by 24.1%. Find undervalued stocks or create your own screener to find better value opportunities.
Approach 2: Colliers International Group Price vs Earnings
The Price-to-Earnings (PE) ratio is often considered the go-to valuation tool for profitable companies like Colliers International Group. The PE ratio gives investors a sense of how much they are paying for every dollar of the company’s earnings. This makes it a practical way to benchmark against market expectations and competitors.
What counts as a “normal” or “fair” PE ratio will depend on several factors. Companies with higher expected future growth or lower risk profiles can command higher PE multiples, while those facing headwinds or slower earnings increases may deserve a discount. Market sentiment, economic cycles, and shifts in the commercial real estate sector all influence where a company’s PE should land.
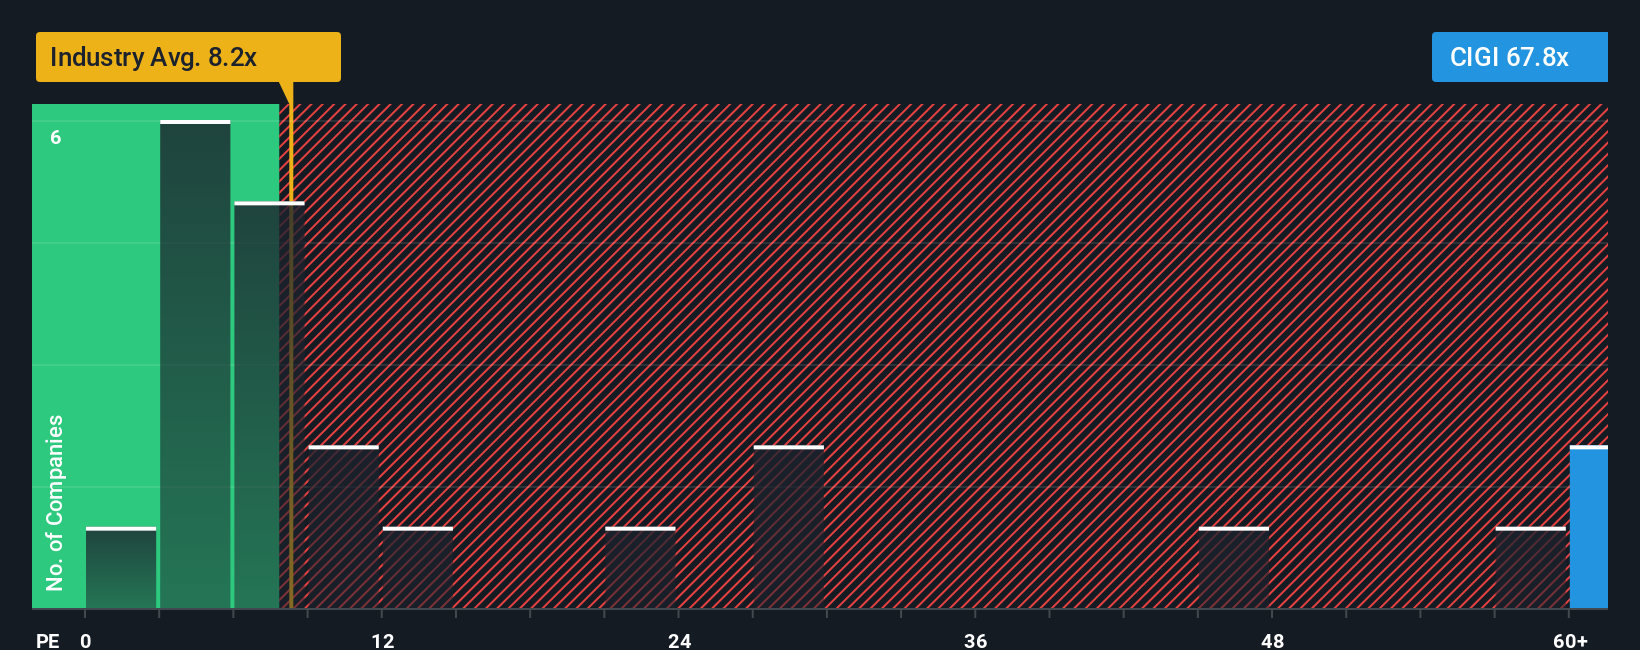
Currently, Colliers trades at a PE ratio of 68.6x, notably higher than both the Real Estate industry average of 15.5x and its peer group, which averages 53.3x. To refine this comparison, Simply Wall St uses a proprietary “Fair Ratio”, which takes into account not just earnings growth but also risk, profit margins, company size, and industry dynamics. For Colliers, the Fair Ratio is 42.7x. This approach provides deeper context than a straight benchmark because it blends both quantitative factors and sector insights into a single, actionable number.
Measured against the Fair Ratio, Colliers’ current PE is well above what would normally be justified, even taking its prospects and risks into account. This suggests the stock is trading at a premium relative to its underlying fundamentals as assessed by Simply Wall St’s model.
Result: OVERVALUED
PE ratios tell one story, but what if the real opportunity lies elsewhere? Discover companies where insiders are betting big on explosive growth.
Upgrade Your Decision Making: Choose your Colliers International Group Narrative
Earlier we mentioned that there is an even better way to understand valuation. Let’s introduce you to Narratives. Narratives are an approachable, powerful tool that lets you build and visualize your own story for a company; you connect your perspective about Colliers’ future to a financial forecast and a fair value, rather than relying only on standard ratios or analyst targets.
Every Narrative links a company’s business outlook and catalysts to key estimates like revenue growth, profit margins, and risk, producing a living fair value that reflects your unique thinking. On Simply Wall St’s Community page used by millions, creating or following a Narrative is simple and intuitive. This turns research into actionable signals so you can see if the current price is above or below your fair value and decide whether to buy or sell.
Narratives are always evolving and update automatically when fresh news or earnings emerge, so your view and valuation stay relevant no matter how markets move. For Colliers International Group, for example, one bullish Narrative might expect sustained digital transformation and alternative assets growth, supporting a fair value as high as CA$255.23. A more cautious view might foresee cyclical headwinds and margin risk, suggesting a fair value closer to CA$187.24.
Do you think there's more to the story for Colliers International Group? Create your own Narrative to let the Community know!
This article by Simply Wall St is general in nature. We provide commentary based on historical data and analyst forecasts only using an unbiased methodology and our articles are not intended to be financial advice. It does not constitute a recommendation to buy or sell any stock, and does not take account of your objectives, or your financial situation. We aim to bring you long-term focused analysis driven by fundamental data. Note that our analysis may not factor in the latest price-sensitive company announcements or qualitative material. Simply Wall St has no position in any stocks mentioned.
New: AI Stock Screener & Alerts
Our new AI Stock Screener scans the market every day to uncover opportunities.
• Dividend Powerhouses (3%+ Yield)
• Undervalued Small Caps with Insider Buying
• High growth Tech and AI Companies
Or build your own from over 50 metrics.
Have feedback on this article? Concerned about the content? Get in touch with us directly. Alternatively, email editorial-team@simplywallst.com
About TSX:CIGI
Colliers International Group
Provides commercial real estate to corporate and institutional clients in the United States, Canada, Europe, Australia, the United Kingdom, Poland, China, India, and internationally.
High growth potential with mediocre balance sheet.
Similar Companies
Market Insights

Advertisement
Community Narratives
MicroVision will explode future revenue by 380.37% with a vision towards success
Fair Value US$60|98.4% undervalued
TH
Community Contributor
The Indispensable Artery for a New North American Economy
Fair Value CA$132.87|0.7% overvalued
TI
Community Contributor
Recently Updated Narratives
CE

cementafriend on Constellation Energy ·
Constellation Energy Dividends and Growth
Fair Value:US$348.054.7% overvalued
2 followersusers have followed this narrative
0 commentsusers have commented on this narrative
0 likesusers have liked this narrative
KH

Khagani on CoreWeave ·
CoreWeave's Revenue Expected to Rocket 77.88% in 5-Year Forecast
Fair Value:US$11033.5% undervalued
4 followersusers have followed this narrative
0 commentsusers have commented on this narrative
0 likesusers have liked this narrative
PO

PortfolioPlus on Bisalloy Steel Group ·
Bisalloy Steel Group will shine with a projected profit margin increase of 12.8%
Fair Value:AU$6.7117.6% undervalued
3 followersusers have followed this narrative
0 commentsusers have commented on this narrative
0 likesusers have liked this narrative
Popular Narratives
TH

TheWallstreetKing on MicroVision ·
MicroVision will explode future revenue by 380.37% with a vision towards success
Fair Value:US$6098.4% undervalued
108 followersusers have followed this narrative
10 commentsusers have commented on this narrative
21 likesusers have liked this narrative
AN


AnalystConsensusTarget on NVIDIA ·
NVDA: Expanding AI Demand Will Drive Major Data Center Investments Through 2026
Fair Value:US$250.3929.3% undervalued
936 followersusers have followed this narrative
6 commentsusers have commented on this narrative
24 likesusers have liked this narrative
OS


oscargarcia on Alphabet ·
The company that turned a verb into a global necessity and basically runs the modern internet, digital ads, smartphones, maps, and AI.
Fair Value:US$3405.8% undervalued
144 followersusers have followed this narrative
6 commentsusers have commented on this narrative
18 likesusers have liked this narrative