
Advertisement
- Canada
- /
- Real Estate
- /
- TSX:CIGI
Does This Valuation Of Colliers International Group Inc. (TSE:CIGI) Imply Investors Are Overpaying?

Key Insights
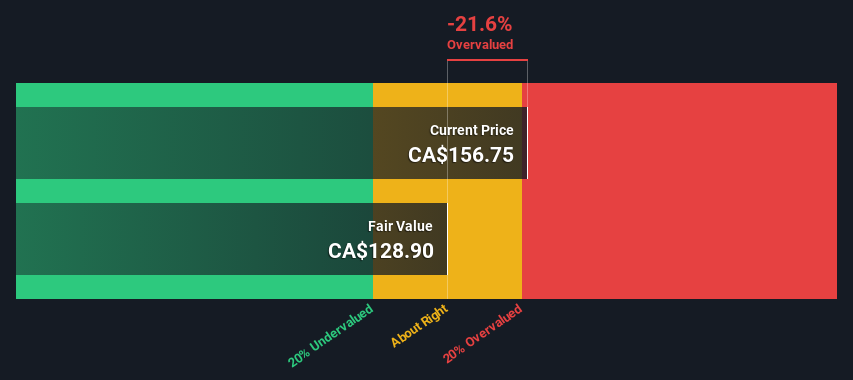
- Colliers International Group's estimated fair value is CA$129 based on 2 Stage Free Cash Flow to Equity
- Colliers International Group's CA$157 share price signals that it might be 22% overvalued
- Analyst price target for CIGI is US$147, which is 14% above our fair value estimate
Today we will run through one way of estimating the intrinsic value of Colliers International Group Inc. (TSE:CIGI) by taking the forecast future cash flows of the company and discounting them back to today's value. The Discounted Cash Flow (DCF) model is the tool we will apply to do this. Believe it or not, it's not too difficult to follow, as you'll see from our example!
We would caution that there are many ways of valuing a company and, like the DCF, each technique has advantages and disadvantages in certain scenarios. For those who are keen learners of equity analysis, the Simply Wall St analysis model here may be something of interest to you.
See our latest analysis for Colliers International Group
Step By Step Through The Calculation
We're using the 2-stage growth model, which simply means we take in account two stages of company's growth. In the initial period the company may have a higher growth rate and the second stage is usually assumed to have a stable growth rate. To start off with, we need to estimate the next ten years of cash flows. Where possible we use analyst estimates, but when these aren't available we extrapolate the previous free cash flow (FCF) from the last estimate or reported value. We assume companies with shrinking free cash flow will slow their rate of shrinkage, and that companies with growing free cash flow will see their growth rate slow, over this period. We do this to reflect that growth tends to slow more in the early years than it does in later years.
Generally we assume that a dollar today is more valuable than a dollar in the future, so we need to discount the sum of these future cash flows to arrive at a present value estimate:
10-year free cash flow (FCF) estimate
| 2024 | 2025 | 2026 | 2027 | 2028 | 2029 | 2030 | 2031 | 2032 | 2033 | |
| Levered FCF ($, Millions) | US$230.0m | US$256.0m | US$275.1m | US$291.1m | US$304.6m | US$316.3m | US$326.6m | US$336.0m | US$344.7m | US$352.9m |
| Growth Rate Estimate Source | Analyst x1 | Analyst x1 | Est @ 7.47% | Est @ 5.81% | Est @ 4.65% | Est @ 3.83% | Est @ 3.26% | Est @ 2.86% | Est @ 2.58% | Est @ 2.39% |
| Present Value ($, Millions) Discounted @ 8.2% | US$213 | US$219 | US$217 | US$212 | US$205 | US$197 | US$188 | US$179 | US$169 | US$160 |
("Est" = FCF growth rate estimated by Simply Wall St)
Present Value of 10-year Cash Flow (PVCF) = US$2.0b
The second stage is also known as Terminal Value, this is the business's cash flow after the first stage. The Gordon Growth formula is used to calculate Terminal Value at a future annual growth rate equal to the 5-year average of the 10-year government bond yield of 1.9%. We discount the terminal cash flows to today's value at a cost of equity of 8.2%.
Terminal Value (TV)= FCF2033 × (1 + g) ÷ (r – g) = US$353m× (1 + 1.9%) ÷ (8.2%– 1.9%) = US$5.7b
Present Value of Terminal Value (PVTV)= TV / (1 + r)10= US$5.7b÷ ( 1 + 8.2%)10= US$2.6b
The total value is the sum of cash flows for the next ten years plus the discounted terminal value, which results in the Total Equity Value, which in this case is US$4.6b. To get the intrinsic value per share, we divide this by the total number of shares outstanding. Relative to the current share price of CA$157, the company appears slightly overvalued at the time of writing. The assumptions in any calculation have a big impact on the valuation, so it is better to view this as a rough estimate, not precise down to the last cent.
Important Assumptions
Now the most important inputs to a discounted cash flow are the discount rate, and of course, the actual cash flows. Part of investing is coming up with your own evaluation of a company's future performance, so try the calculation yourself and check your own assumptions. The DCF also does not consider the possible cyclicality of an industry, or a company's future capital requirements, so it does not give a full picture of a company's potential performance. Given that we are looking at Colliers International Group as potential shareholders, the cost of equity is used as the discount rate, rather than the cost of capital (or weighted average cost of capital, WACC) which accounts for debt. In this calculation we've used 8.2%, which is based on a levered beta of 1.258. Beta is a measure of a stock's volatility, compared to the market as a whole. We get our beta from the industry average beta of globally comparable companies, with an imposed limit between 0.8 and 2.0, which is a reasonable range for a stable business.
SWOT Analysis for Colliers International Group
Strength
- Debt is well covered by earnings.
Weakness
- Earnings declined over the past year.
- Dividend is low compared to the top 25% of dividend payers in the Real Estate market.
- Shareholders have been diluted in the past year.
Opportunity
- Annual earnings are forecast to grow faster than the Canadian market.
- Good value based on P/S ratio compared to estimated Fair P/S ratio.
Threat
- Debt is not well covered by operating cash flow.
- Annual revenue is forecast to grow slower than the Canadian market.
Next Steps:
Valuation is only one side of the coin in terms of building your investment thesis, and it ideally won't be the sole piece of analysis you scrutinize for a company. The DCF model is not a perfect stock valuation tool. Instead the best use for a DCF model is to test certain assumptions and theories to see if they would lead to the company being undervalued or overvalued. For instance, if the terminal value growth rate is adjusted slightly, it can dramatically alter the overall result. Why is the intrinsic value lower than the current share price? For Colliers International Group, we've compiled three pertinent elements you should further research:
- Risks: Every company has them, and we've spotted 5 warning signs for Colliers International Group (of which 1 doesn't sit too well with us!) you should know about.
- Future Earnings: How does CIGI's growth rate compare to its peers and the wider market? Dig deeper into the analyst consensus number for the upcoming years by interacting with our free analyst growth expectation chart.
- Other High Quality Alternatives: Do you like a good all-rounder? Explore our interactive list of high quality stocks to get an idea of what else is out there you may be missing!
PS. Simply Wall St updates its DCF calculation for every Canadian stock every day, so if you want to find the intrinsic value of any other stock just search here.
New: AI Stock Screener & Alerts
Our new AI Stock Screener scans the market every day to uncover opportunities.
• Dividend Powerhouses (3%+ Yield)
• Undervalued Small Caps with Insider Buying
• High growth Tech and AI Companies
Or build your own from over 50 metrics.
Have feedback on this article? Concerned about the content? Get in touch with us directly. Alternatively, email editorial-team (at) simplywallst.com.
This article by Simply Wall St is general in nature. We provide commentary based on historical data and analyst forecasts only using an unbiased methodology and our articles are not intended to be financial advice. It does not constitute a recommendation to buy or sell any stock, and does not take account of your objectives, or your financial situation. We aim to bring you long-term focused analysis driven by fundamental data. Note that our analysis may not factor in the latest price-sensitive company announcements or qualitative material. Simply Wall St has no position in any stocks mentioned.
About TSX:CIGI
Colliers International Group
Provides commercial real estate to corporate and institutional clients in the United States, Canada, Europe, Australia, the United Kingdom, Poland, China, India, and internationally.
Solid track record with reasonable growth potential.
Similar Companies
Market Insights


Advertisement
Community Narratives
Nike's Direct-to-Consumer Focus Will Drive Future Growth
Fair Value US$87.90|18.2% undervalued
UN
Community Contributor
Novo Nordisk will dominate GLP-1 market with Ozempic and Wegovy growth
Fair Value US$89.59|12.1% undervalued
BE
Community Contributor
Rheinmetall could get 20-25% of EU-NATO 3%-GDP defence spending
Fair Value €7.57k|82.8% undervalued
NO
Community Contributor