
Advertisement
- Canada
- /
- Metals and Mining
- /
- TSXV:SR
We're Keeping An Eye On Strategic Resources' (CVE:SR) Cash Burn Rate
We can readily understand why investors are attracted to unprofitable companies. For example, although software-as-a-service business Salesforce.com lost money for years while it grew recurring revenue, if you held shares since 2005, you'd have done very well indeed. Having said that, unprofitable companies are risky because they could potentially burn through all their cash and become distressed.
So should Strategic Resources (CVE:SR) shareholders be worried about its cash burn? For the purposes of this article, cash burn is the annual rate at which an unprofitable company spends cash to fund its growth; its negative free cash flow. The first step is to compare its cash burn with its cash reserves, to give us its 'cash runway'.
View our latest analysis for Strategic Resources
Does Strategic Resources Have A Long Cash Runway?
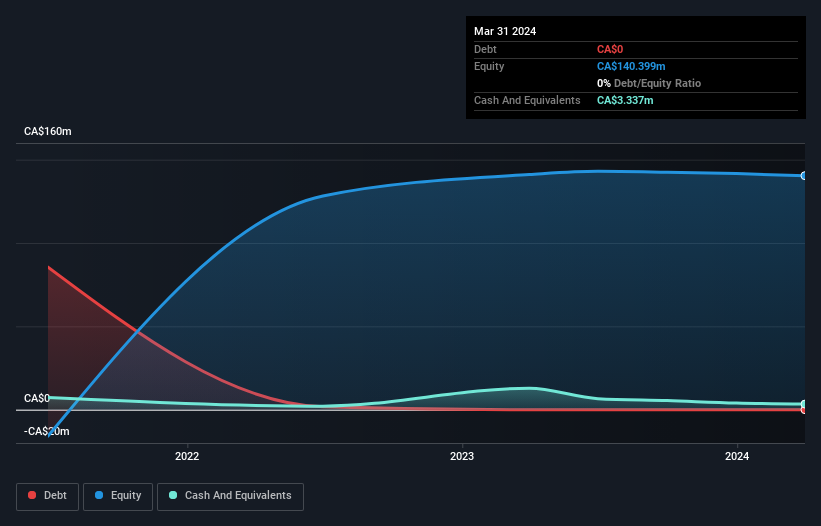
A cash runway is defined as the length of time it would take a company to run out of money if it kept spending at its current rate of cash burn. As at March 2024, Strategic Resources had cash of CA$3.3m and no debt. Importantly, its cash burn was CA$5.5m over the trailing twelve months. That means it had a cash runway of around 7 months as of March 2024. To be frank, this kind of short runway puts us on edge, as it indicates the company must reduce its cash burn significantly, or else raise cash imminently. You can see how its cash balance has changed over time in the image below.
How Is Strategic Resources' Cash Burn Changing Over Time?
Strategic Resources didn't record any revenue over the last year, indicating that it's an early stage company still developing its business. So while we can't look to sales to understand growth, we can look at how the cash burn is changing to understand how expenditure is trending over time. Over the last year its cash burn actually increased by 4.9%, which suggests that management are increasing investment in future growth, but not too quickly. That's not necessarily a bad thing, but investors should be mindful of the fact that will shorten the cash runway. Admittedly, we're a bit cautious of Strategic Resources due to its lack of significant operating revenues. So we'd generally prefer stocks from this list of stocks that have analysts forecasting growth.
Can Strategic Resources Raise More Cash Easily?
While its cash burn is only increasing slightly, Strategic Resources shareholders should still consider the potential need for further cash, down the track. Generally speaking, a listed business can raise new cash through issuing shares or taking on debt. Many companies end up issuing new shares to fund future growth. By looking at a company's cash burn relative to its market capitalisation, we gain insight on how much shareholders would be diluted if the company needed to raise enough cash to cover another year's cash burn.
Strategic Resources has a market capitalisation of CA$34m and burnt through CA$5.5m last year, which is 16% of the company's market value. As a result, we'd venture that the company could raise more cash for growth without much trouble, albeit at the cost of some dilution.
So, Should We Worry About Strategic Resources' Cash Burn?
Even though its cash runway makes us a little nervous, we are compelled to mention that we thought Strategic Resources' cash burn relative to its market cap was relatively promising. Looking at the factors mentioned in this short report, we do think that its cash burn is a bit risky, and it does make us slightly nervous about the stock. Separately, we looked at different risks affecting the company and spotted 3 warning signs for Strategic Resources (of which 2 are a bit concerning!) you should know about.
Of course Strategic Resources may not be the best stock to buy. So you may wish to see this free collection of companies boasting high return on equity, or this list of stocks with high insider ownership.
New: Manage All Your Stock Portfolios in One Place
We've created the ultimate portfolio companion for stock investors, and it's free.
• Connect an unlimited number of Portfolios and see your total in one currency
• Be alerted to new Warning Signs or Risks via email or mobile
• Track the Fair Value of your stocks
Have feedback on this article? Concerned about the content? Get in touch with us directly. Alternatively, email editorial-team (at) simplywallst.com.
This article by Simply Wall St is general in nature. We provide commentary based on historical data and analyst forecasts only using an unbiased methodology and our articles are not intended to be financial advice. It does not constitute a recommendation to buy or sell any stock, and does not take account of your objectives, or your financial situation. We aim to bring you long-term focused analysis driven by fundamental data. Note that our analysis may not factor in the latest price-sensitive company announcements or qualitative material. Simply Wall St has no position in any stocks mentioned.
About TSXV:SR
Strategic Resources
Engages in the acquisition, exploration, and development of iron, vanadium, titanium, and other metal properties in Canada and Finland.
Good value with adequate balance sheet.
Market Insights


Advertisement
Community Narratives
America Wants Homegrown Drones — Draganfly Is Ready to Deliver
Fair Value US$9.21|24.5% undervalued
JO
Community Contributor
Cheesecake Factory offers an enticing opportunity for long-term growth by leveraging new concepts
Fair Value US$73.83|24.8% undervalued
ZW
Community Contributor
Coca-Cola’s Intrinsic Value Set to Rise with Fed Rate Cut
Fair Value US$67.50|2.2% undervalued
AL
Community Contributor
Fully Permitted Gold Mine with 50 Baggers Potential 
Fair Value CA$41.00|97.7% undervalued
RO
Community Contributor