
Advertisement
- Canada
- /
- Metals and Mining
- /
- TSXV:RDU
We're Not Very Worried About Radius Gold's (CVE:RDU) Cash Burn Rate
We can readily understand why investors are attracted to unprofitable companies. For example, although Amazon.com made losses for many years after listing, if you had bought and held the shares since 1999, you would have made a fortune. But the harsh reality is that very many loss making companies burn through all their cash and go bankrupt.
Given this risk, we thought we'd take a look at whether Radius Gold (CVE:RDU) shareholders should be worried about its cash burn. In this article, we define cash burn as its annual (negative) free cash flow, which is the amount of money a company spends each year to fund its growth. Let's start with an examination of the business' cash, relative to its cash burn.
Check out our latest analysis for Radius Gold
Does Radius Gold Have A Long Cash Runway?
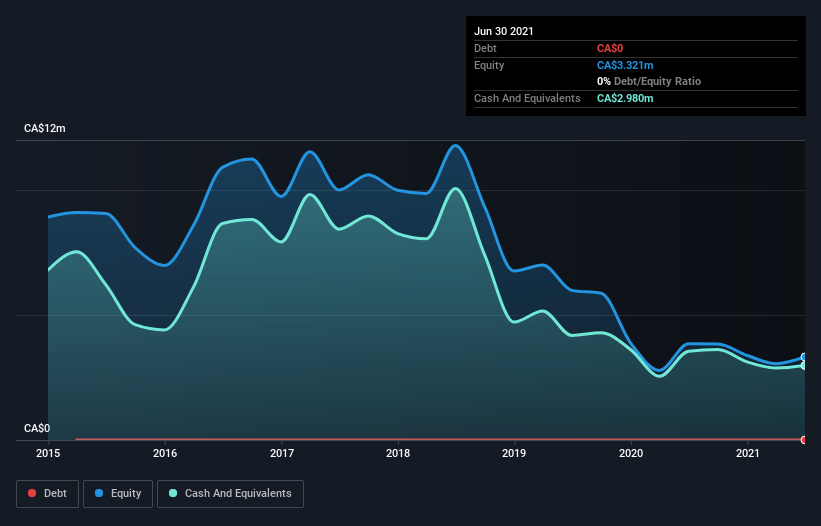
A company's cash runway is calculated by dividing its cash hoard by its cash burn. In June 2021, Radius Gold had CA$3.0m in cash, and was debt-free. Importantly, its cash burn was CA$1.3m over the trailing twelve months. So it had a cash runway of about 2.4 years from June 2021. Arguably, that's a prudent and sensible length of runway to have. Depicted below, you can see how its cash holdings have changed over time.
How Is Radius Gold's Cash Burn Changing Over Time?
Because Radius Gold isn't currently generating revenue, we consider it an early-stage business. Nonetheless, we can still examine its cash burn trajectory as part of our assessment of its cash burn situation. While it hardly paints a picture of imminent growth, the fact that it has reduced its cash burn by 21% over the last year suggests some degree of prudence. Radius Gold makes us a little nervous due to its lack of substantial operating revenue. So we'd generally prefer stocks from this list of stocks that have analysts forecasting growth.
How Easily Can Radius Gold Raise Cash?
Even though it has reduced its cash burn recently, shareholders should still consider how easy it would be for Radius Gold to raise more cash in the future. Generally speaking, a listed business can raise new cash through issuing shares or taking on debt. Many companies end up issuing new shares to fund future growth. By comparing a company's annual cash burn to its total market capitalisation, we can estimate roughly how many shares it would have to issue in order to run the company for another year (at the same burn rate).
Since it has a market capitalisation of CA$29m, Radius Gold's CA$1.3m in cash burn equates to about 4.3% of its market value. Given that is a rather small percentage, it would probably be really easy for the company to fund another year's growth by issuing some new shares to investors, or even by taking out a loan.
How Risky Is Radius Gold's Cash Burn Situation?
As you can probably tell by now, we're not too worried about Radius Gold's cash burn. In particular, we think its cash burn relative to its market cap stands out as evidence that the company is well on top of its spending. And even though its cash burn reduction wasn't quite as impressive, it was still a positive. After taking into account the various metrics mentioned in this report, we're pretty comfortable with how the company is spending its cash. On another note, Radius Gold has 4 warning signs (and 2 which are potentially serious) we think you should know about.
If you would prefer to check out another company with better fundamentals, then do not miss this free list of interesting companies, that have HIGH return on equity and low debt or this list of stocks which are all forecast to grow.
New: AI Stock Screener & Alerts
Our new AI Stock Screener scans the market every day to uncover opportunities.
• Dividend Powerhouses (3%+ Yield)
• Undervalued Small Caps with Insider Buying
• High growth Tech and AI Companies
Or build your own from over 50 metrics.
This article by Simply Wall St is general in nature. We provide commentary based on historical data and analyst forecasts only using an unbiased methodology and our articles are not intended to be financial advice. It does not constitute a recommendation to buy or sell any stock, and does not take account of your objectives, or your financial situation. We aim to bring you long-term focused analysis driven by fundamental data. Note that our analysis may not factor in the latest price-sensitive company announcements or qualitative material. Simply Wall St has no position in any stocks mentioned.
Have feedback on this article? Concerned about the content? Get in touch with us directly. Alternatively, email editorial-team (at) simplywallst.com.
About TSXV:RDU
Radius Gold
Engages in the acquisition and exploration of mineral properties.
Flawless balance sheet with low risk.
Market Insights

Advertisement
Weekly Picks
RO


RockeTeller on Santacruz Silver Mining ·
Crazy Undervalued 42 Baggers Silver Play (Active & Running Mine)
Fair Value:CA$8696.4% undervalued
34 followersusers have followed this narrative
6 commentsusers have commented on this narrative
9 likesusers have liked this narrative
RO


Robbo on Fiducian Group ·
Fiducian: Compliance Clouds or Value Opportunity?
Fair Value:AU$126.1% undervalued
4 followersusers have followed this narrative
0 commentsusers have commented on this narrative
0 likesusers have liked this narrative
WO

woodworthfund on Willamette Valley Vineyards ·
Willamette Valley Vineyards (WVVI): Not-So-Great Value
Fair Value:US$244.5% overvalued
6 followersusers have followed this narrative
0 commentsusers have commented on this narrative
1 likeusers have liked this narrative
Recently Updated Narratives
FU

FundamentallySarcastic on Credit Corp Group ·
Moderation and Stabilisation: HOLD: Fair Price based on a 4-year Cycle is $12.08
Fair Value:AU$12.6411.4% overvalued
1 followerusers have followed this narrative
0 commentsusers have commented on this narrative
0 likesusers have liked this narrative
MA


MarkoVT on Alphabet ·
Positioned globally, partnered locally
Fair Value:US$390.1918.1% undervalued
1 followerusers have followed this narrative
0 commentsusers have commented on this narrative
0 likesusers have liked this narrative
JO


JohnJ on Worldline ·
When will fraudsters be investigated in depth. Fraud was ongoing in France too.
Fair Value:€0.5190.0% overvalued
1 followerusers have followed this narrative
0 commentsusers have commented on this narrative
0 likesusers have liked this narrative
Popular Narratives
TH


TheWallstreetKing on MicroVision ·
MicroVision will explode future revenue by 380.37% with a vision towards success
Fair Value:US$6098.6% undervalued
112 followersusers have followed this narrative
11 commentsusers have commented on this narrative
22 likesusers have liked this narrative
AN


AnalystConsensusTarget on NVIDIA ·
NVDA: Expanding AI Demand Will Drive Major Data Center Investments Through 2026
Fair Value:US$250.3927.5% undervalued
951 followersusers have followed this narrative
6 commentsusers have commented on this narrative
25 likesusers have liked this narrative
OS

oscargarcia on Alphabet ·
The company that turned a verb into a global necessity and basically runs the modern internet, digital ads, smartphones, maps, and AI.
Fair Value:US$3406.0% undervalued
148 followersusers have followed this narrative
6 commentsusers have commented on this narrative
18 likesusers have liked this narrative

