- Canada
- /
- Metals and Mining
- /
- TSXV:DEX
Discovering Opportunities: Almadex Minerals Among 3 TSX Penny Stocks

Reviewed by Simply Wall St

As the Canadian market navigates a period of economic resilience and fluctuating bond yields, investors are closely watching how these factors impact stock valuations. Amidst this backdrop, penny stocks, often representing smaller or newer companies, continue to intrigue investors with their blend of affordability and potential for growth. Despite being considered a relic by some, these stocks can still offer compelling opportunities when backed by strong financials.
Top 10 Penny Stocks In Canada
| Name | Share Price | Market Cap | Financial Health Rating |
| Silvercorp Metals (TSX:SVM) | CA$4.53 | CA$965.98M | ★★★★★★ |
| Mandalay Resources (TSX:MND) | CA$4.14 | CA$397.24M | ★★★★★★ |
| Pulse Seismic (TSX:PSD) | CA$2.43 | CA$123.54M | ★★★★★★ |
| Findev (TSXV:FDI) | CA$0.50 | CA$14.32M | ★★★★★★ |
| PetroTal (TSX:TAL) | CA$0.73 | CA$687.7M | ★★★★★★ |
| Foraco International (TSX:FAR) | CA$2.33 | CA$218.52M | ★★★★★☆ |
| NamSys (TSXV:CTZ) | CA$1.11 | CA$32.24M | ★★★★★★ |
| East West Petroleum (TSXV:EW) | CA$0.035 | CA$3.17M | ★★★★★★ |
| Hemisphere Energy (TSXV:HME) | CA$1.85 | CA$178.64M | ★★★★★☆ |
| Tornado Infrastructure Equipment (TSXV:TGH) | CA$1.00 | CA$140.31M | ★★★★★☆ |
Click here to see the full list of 933 stocks from our TSX Penny Stocks screener.
Here we highlight a subset of our preferred stocks from the screener.
Almadex Minerals (TSXV:DEX)
Simply Wall St Financial Health Rating: ★★★★★★
Overview: Almadex Minerals Ltd. is involved in the acquisition and exploration of mineral resource properties across Canada, the United States, and Mexico, with a market cap of CA$10.68 million.
Operations: The company generates revenue of CA$0.04 million from its activities related to acquiring and exploring mineral resource properties.
Market Cap: CA$10.68M
Almadex Minerals Ltd., with a market cap of CA$10.68 million, is pre-revenue and focuses on mineral exploration in North America, notably the Paradise-Davis Project in Nevada. Recent activities include drilling at the Sinter Zone, which revealed challenging conditions due to unexpected fault zones. The company has no debt and sufficient cash runway for over three years based on current free cash flow. Despite being unprofitable, Almadex has reduced its losses by 12.5% annually over five years and maintains stable weekly volatility at 9%. Its board of directors is experienced with an average tenure of 6.9 years.
- Click to explore a detailed breakdown of our findings in Almadex Minerals' financial health report.
- Examine Almadex Minerals' past performance report to understand how it has performed in prior years.

Max Resource (TSXV:MAX)
Simply Wall St Financial Health Rating: ★★★★★★
Overview: Max Resource Corp. is involved in acquiring and exploring mineral properties in South America and Canada, with a market cap of CA$9.89 million.
Operations: Max Resource Corp. does not report any revenue segments.
Market Cap: CA$9.89M
Max Resource Corp., with a market cap of CA$9.89 million, is pre-revenue and focuses on mineral exploration in South America and Canada. Despite being debt-free, the company faces financial challenges with a cash runway of only three months based on free cash flow estimates, though it has recently raised additional capital. Recent developments include expanding its Florália Hematite project in Brazil, revealing significant potential for high-grade iron ore through advanced drone magnetics surveys. The company's management team is experienced with an average tenure of 6.8 years, but earnings have been declining at 12.5% annually over the past five years amidst high share price volatility.
- Click here and access our complete financial health analysis report to understand the dynamics of Max Resource.
- Assess Max Resource's previous results with our detailed historical performance reports.

Western Energy Services (TSX:WRG)
Simply Wall St Financial Health Rating: ★★★★★☆
Overview: Western Energy Services Corp. is an oilfield service company operating in Canada and the United States, with a market cap of CA$92.05 million.
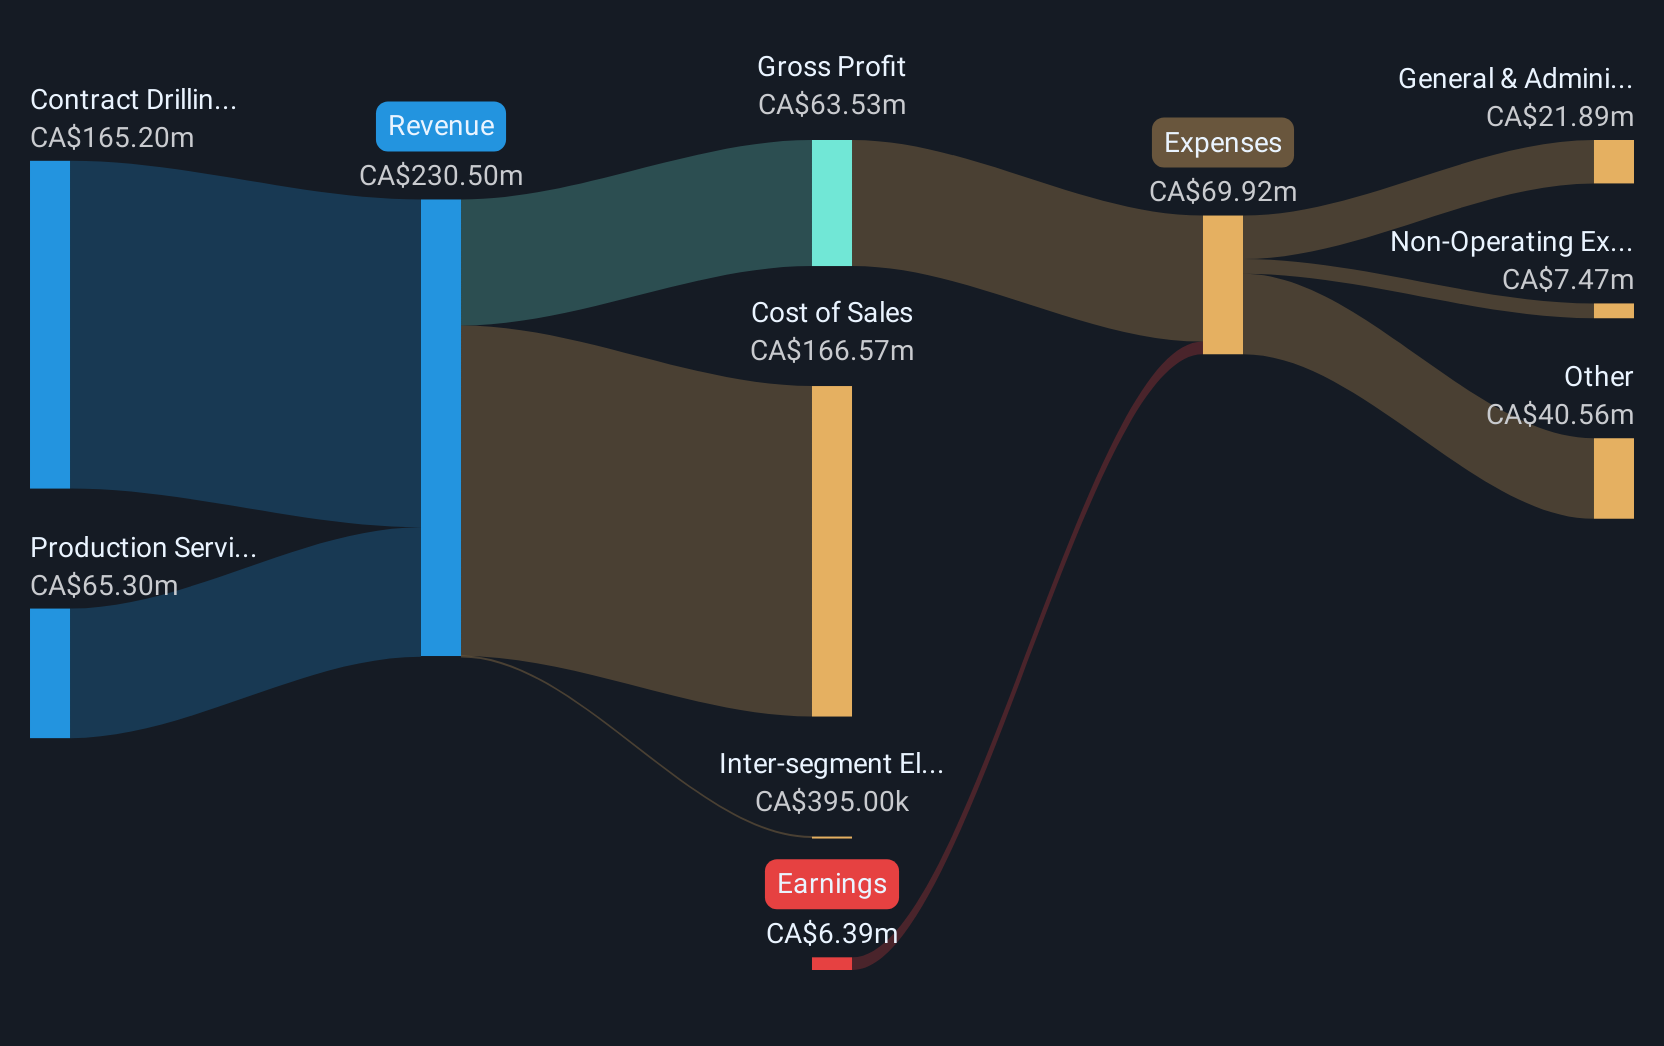
Operations: The company's revenue is derived from two main segments: Contract Drilling, which generated CA$148.07 million, and Production Services, contributing CA$71.89 million.
Market Cap: CA$92.05M
Western Energy Services Corp., with a market cap of CA$92.05 million, operates in the oilfield services sector across Canada and the U.S. Despite being unprofitable, it has reduced losses by 50.2% annually over five years and maintains a positive cash flow with sufficient runway for over three years. The company reported third-quarter sales of CA$58.34 million, slightly up from last year, though net loss remains at CA$1.26 million. Its debt to equity ratio improved significantly to 34.1%, indicating better financial health, while its board and management team are highly experienced with long tenures.
- Navigate through the intricacies of Western Energy Services with our comprehensive balance sheet health report here.
- Learn about Western Energy Services' future growth trajectory here.

Seize The Opportunity
- Unlock our comprehensive list of 933 TSX Penny Stocks by clicking here.
- Invested in any of these stocks? Simplify your portfolio management with Simply Wall St and stay ahead with our alerts for any critical updates on your stocks.
- Maximize your investment potential with Simply Wall St, the comprehensive app that offers global market insights for free.
Interested In Other Possibilities?
- Explore high-performing small cap companies that haven't yet garnered significant analyst attention.
- Jump on the AI train with fast growing tech companies forging a new era of innovation.
- Find companies with promising cash flow potential yet trading below their fair value.
This article by Simply Wall St is general in nature. We provide commentary based on historical data and analyst forecasts only using an unbiased methodology and our articles are not intended to be financial advice. It does not constitute a recommendation to buy or sell any stock, and does not take account of your objectives, or your financial situation. We aim to bring you long-term focused analysis driven by fundamental data. Note that our analysis may not factor in the latest price-sensitive company announcements or qualitative material. Simply Wall St has no position in any stocks mentioned.
New: Manage All Your Stock Portfolios in One Place
We've created the ultimate portfolio companion for stock investors, and it's free.
• Connect an unlimited number of Portfolios and see your total in one currency
• Be alerted to new Warning Signs or Risks via email or mobile
• Track the Fair Value of your stocks
Have feedback on this article? Concerned about the content? Get in touch with us directly. Alternatively, email editorial-team@simplywallst.com
About TSXV:DEX
Almadex Minerals
Engages in the acquisition and exploration of mineral resource properties in Canada, the United States, and Mexico.
Flawless balance sheet and slightly overvalued.
