- Canada
- /
- Metals and Mining
- /
- TSXV:TAU
Here's Why We're Not Too Worried About Benchmark Metals' (CVE:BNCH) Cash Burn Situation

There's no doubt that money can be made by owning shares of unprofitable businesses. By way of example, Benchmark Metals (CVE:BNCH) has seen its share price rise 581% over the last year, delighting many shareholders. Nonetheless, only a fool would ignore the risk that a loss making company burns through its cash too quickly.
So notwithstanding the buoyant share price, we think it's well worth asking whether Benchmark Metals' cash burn is too risky. For the purposes of this article, cash burn is the annual rate at which an unprofitable company spends cash to fund its growth; its negative free cash flow. First, we'll determine its cash runway by comparing its cash burn with its cash reserves.
See our latest analysis for Benchmark Metals
How Long Is Benchmark Metals' Cash Runway?
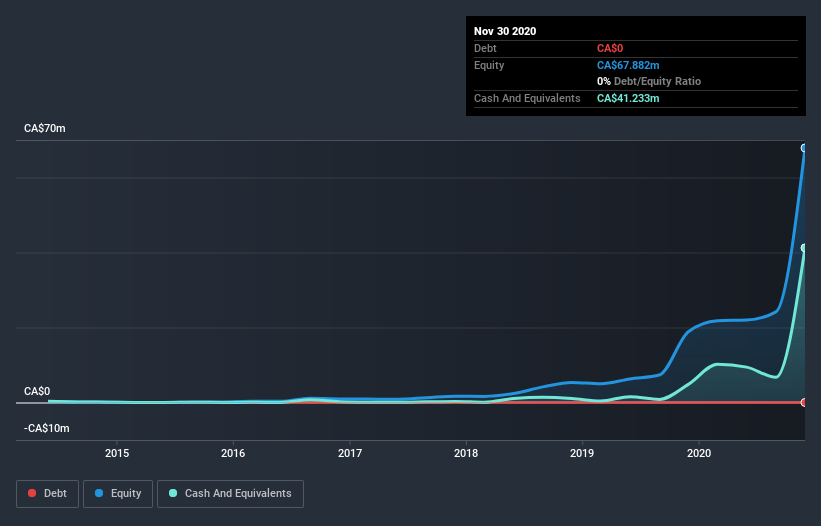
A company's cash runway is calculated by dividing its cash hoard by its cash burn. In November 2020, Benchmark Metals had CA$41m in cash, and was debt-free. Importantly, its cash burn was CA$19m over the trailing twelve months. So it had a cash runway of about 2.2 years from November 2020. That's decent, giving the company a couple years to develop its business. Depicted below, you can see how its cash holdings have changed over time.

How Is Benchmark Metals' Cash Burn Changing Over Time?
Because Benchmark Metals isn't currently generating revenue, we consider it an early-stage business. Nonetheless, we can still examine its cash burn trajectory as part of our assessment of its cash burn situation. The skyrocketing cash burn up 178% year on year certainly tests our nerves. That sort of spending growth rate can't continue for very long before it causes balance sheet weakness, generally speaking. Benchmark Metals makes us a little nervous due to its lack of substantial operating revenue. So we'd generally prefer stocks from this list of stocks that have analysts forecasting growth.
How Easily Can Benchmark Metals Raise Cash?
Given its cash burn trajectory, Benchmark Metals shareholders may wish to consider how easily it could raise more cash, despite its solid cash runway. Companies can raise capital through either debt or equity. Commonly, a business will sell new shares in itself to raise cash and drive growth. We can compare a company's cash burn to its market capitalisation to get a sense for how many new shares a company would have to issue to fund one year's operations.
Benchmark Metals has a market capitalisation of CA$233m and burnt through CA$19m last year, which is 8.2% of the company's market value. That's a low proportion, so we figure the company would be able to raise more cash to fund growth, with a little dilution, or even to simply borrow some money.
Is Benchmark Metals' Cash Burn A Worry?
Even though its increasing cash burn makes us a little nervous, we are compelled to mention that we thought Benchmark Metals' cash burn relative to its market cap was relatively promising. While we're the kind of investors who are always a bit concerned about the risks involved with cash burning companies, the metrics we have discussed in this article leave us relatively comfortable about Benchmark Metals' situation. Taking a deeper dive, we've spotted 3 warning signs for Benchmark Metals you should be aware of, and 1 of them is concerning.
Of course Benchmark Metals may not be the best stock to buy. So you may wish to see this free collection of companies boasting high return on equity, or this list of stocks that insiders are buying.
If you’re looking to trade Benchmark Metals, open an account with the lowest-cost* platform trusted by professionals, Interactive Brokers. Their clients from over 200 countries and territories trade stocks, options, futures, forex, bonds and funds worldwide from a single integrated account. Promoted
Valuation is complex, but we're here to simplify it.
Discover if Thesis Gold might be undervalued or overvalued with our detailed analysis, featuring fair value estimates, potential risks, dividends, insider trades, and its financial condition.
Access Free AnalysisThis article by Simply Wall St is general in nature. It does not constitute a recommendation to buy or sell any stock, and does not take account of your objectives, or your financial situation. We aim to bring you long-term focused analysis driven by fundamental data. Note that our analysis may not factor in the latest price-sensitive company announcements or qualitative material. Simply Wall St has no position in any stocks mentioned.
*Interactive Brokers Rated Lowest Cost Broker by StockBrokers.com Annual Online Review 2020
Have feedback on this article? Concerned about the content? Get in touch with us directly. Alternatively, email editorial-team (at) simplywallst.com.
About TSXV:TAU
Thesis Gold
A junior resource company, engages in the identification, evaluation, acquisition, and exploration of mineral properties in Canada.
Excellent balance sheet and slightly overvalued.


