Advertisement
- Canada
- /
- Metals and Mining
- /
- TSX:PAAS
Is Pan American Silver Fully Priced After Surging 94% and Benefiting from Record Silver Demand?

Simply Wall St
Reviewed by Bailey Pemberton
If you’ve been watching Pan American Silver, you’re probably wondering if the stock still has room to run, or if now’s the time to take some profits off the table. It’s not every day you see a share that’s posted nearly 94% gains in the past year and more than 87% just since January. That kind of return grabs attention, and it doesn’t seem like a fluke. Over the last three years, the stock is up more than 190%. Even a turbulent five years delivered a solid 41% gain.
Some of this momentum can be traced to shifting market expectations for precious metals and increased demand from both investors and industry. While recent headlines around global economic uncertainty have boosted appetite for safe-haven assets, Pan American Silver’s stock price seems to suggest that investors are also rethinking the company’s long-term prospects.
Looking at how the market values the company, it’s clear there’s debate. According to our valuation check, Pan American Silver scores a 2 out of 6, meaning the company looks undervalued based on two of the six main criteria we measure. That’s a helpful start, but simply adding up checks isn’t the whole story.
Next, we’ll break down exactly which valuation approaches show Pan American Silver as undervalued, and where things look a little pricier. Stick around until the end for a perspective that goes beyond checklists and could give you an even better read on whether the stock still has upside.
Pan American Silver scores just 2/6 on our valuation checks. See what other red flags we found in the full valuation breakdown.
Approach 1: Pan American Silver Discounted Cash Flow (DCF) Analysis
The Discounted Cash Flow (DCF) model estimates intrinsic value by forecasting a company’s future cash flows and then discounting those projections back to today’s dollars. For Pan American Silver, the DCF uses a 2 Stage Free Cash Flow to Equity method that projects cash generation many years ahead.
Currently, the company’s last twelve months’ Free Cash Flow sits at $561 million. Analysts estimate this will rise to $1.02 billion by the end of 2027. Looking further out, Simply Wall St extrapolates annual Free Cash Flows through to 2035, with figures continuing to grow but at a slowing rate over time. These projections anchor the DCF calculation and produce an intrinsic share value estimate of $54.83.
When compared to Pan American Silver’s current market price, the DCF model indicates the shares are about 5.2% above their calculated fair value. In valuation terms, that suggests the stock is close to fully priced but not dramatically overvalued or undervalued at this point.
Result: ABOUT RIGHT

Simply Wall St performs a valuation analysis on every stock in the world every day (check out Pan American Silver's valuation analysis). We show the entire calculation in full. You can track the result in your watchlist or portfolio and be alerted when this changes.
Approach 2: Pan American Silver Price vs Earnings
The Price-to-Earnings (PE) ratio is a widely used valuation tool for profitable companies like Pan American Silver because it directly connects a company's market price to its earnings. For investors, the PE ratio helps gauge how much they are paying for each dollar of earnings generated by the company.
Growth prospects and risk profile can make a big difference in what constitutes a "normal" or "fair" PE ratio for any business. Companies expected to grow faster or with more stable earnings often trade at a higher PE, while those with higher risk or slower growth tend to see lower ratios. This context matters when sizing up Pan American Silver's valuation.
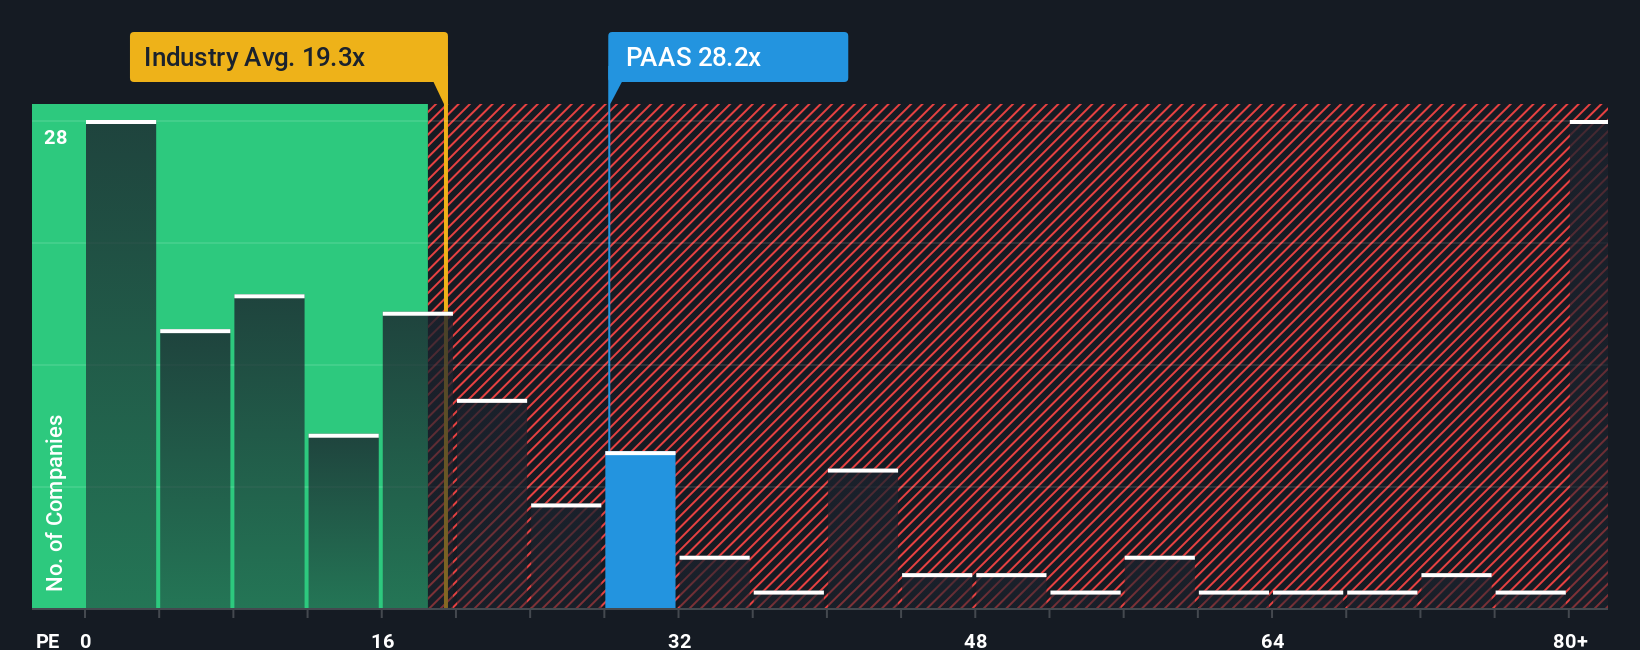
Currently, Pan American Silver trades at a PE ratio of 33.17x. That is higher than the average for the Metals and Mining industry, which stands at 23.83x, but slightly below the average PE of its peers at 35.65x. However, metrics like industry averages and peer comparison do not tell the whole story. The "Fair Ratio" as determined by Simply Wall St for Pan American Silver is 33.83x. This Fair Ratio customizes the benchmark by factoring in the company’s earnings growth, industry context, profit margins, market capitalization, and specific risk profile to provide a more accurate reflection of what the stock’s multiple should be today.
By comparing Pan American Silver’s actual PE of 33.17x to its Fair Ratio of 33.83x, the two numbers line up very closely. This suggests the market is pricing the shares about right, given all the key variables at play.
Result: ABOUT RIGHT
PE ratios tell one story, but what if the real opportunity lies elsewhere? Discover companies where insiders are betting big on explosive growth.
Upgrade Your Decision Making: Choose your Pan American Silver Narrative
Earlier we mentioned that there is an even better way to understand valuation, so let's introduce you to Narratives. A Narrative is simply the story and reasoning you bring to your investment decisions. It is your personal perspective that connects what you think will happen to Pan American Silver’s revenue, earnings, and margins with the fair value you assign to the stock.
Narratives are powerful because they make the link between a company’s story, your financial forecast, and whether you think the current stock price is high, low, or fair. With Simply Wall St’s platform, millions of investors share and update their Narratives on the Community page, making it easy to compare your views with others.
The tool lets you see how changes in news, earnings reports, or new data can dynamically update your chosen Narrative, giving you a live, personalized guide to when you might want to buy or sell by comparing your fair value to the latest price.
For example, some investors believe Pan American Silver is worth over $60 a share, while others set fair value as low as $38. This shows just how varied Narratives can be and how they help you make smarter, faster decisions rooted in your own perspective.
Do you think there's more to the story for Pan American Silver? Create your own Narrative to let the Community know!

This article by Simply Wall St is general in nature. We provide commentary based on historical data and analyst forecasts only using an unbiased methodology and our articles are not intended to be financial advice. It does not constitute a recommendation to buy or sell any stock, and does not take account of your objectives, or your financial situation. We aim to bring you long-term focused analysis driven by fundamental data. Note that our analysis may not factor in the latest price-sensitive company announcements or qualitative material. Simply Wall St has no position in any stocks mentioned.
New: Manage All Your Stock Portfolios in One Place
We've created the ultimate portfolio companion for stock investors, and it's free.
• Connect an unlimited number of Portfolios and see your total in one currency
• Be alerted to new Warning Signs or Risks via email or mobile
• Track the Fair Value of your stocks
Have feedback on this article? Concerned about the content? Get in touch with us directly. Alternatively, email editorial-team@simplywallst.com
About TSX:PAAS
Pan American Silver
Engages in the exploration, mine development, extraction, processing, refining, and reclamation of mines in Canada, Mexico, Peru, Bolivia, Argentina, Chile, and Brazil.
Excellent balance sheet with reasonable growth potential.
Similar Companies
Market Insights

Advertisement
Community Narratives
A formidable player in AI and enterprise computing.
Fair Value US$210.00|13.6% overvalued
CO
Community Contributor
IREN's Bold Moves in Sustainable Bitcoin Mining & AI Data Centers
Fair Value US$89.00|23.6% undervalued
BL
Community Contributor
Cooling the Champions: The Aussie Tech Behind F1's Victories
Fair Value AU$12.40|40.6% undervalued
TR
Community Contributor