
Key Insights
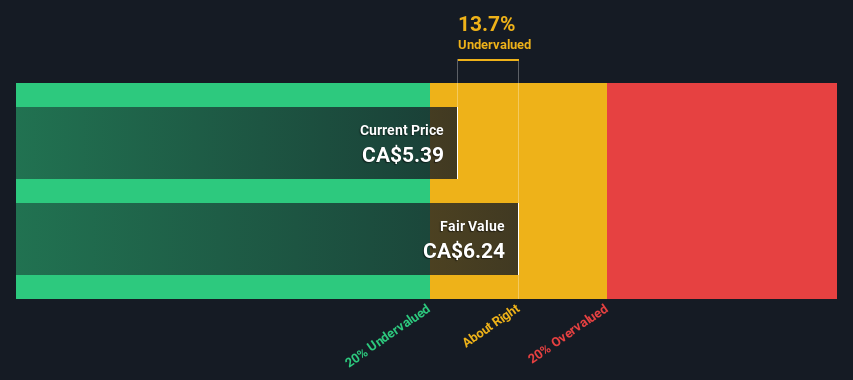
- Using the 2 Stage Free Cash Flow to Equity, K92 Mining fair value estimate is CA$6.24
- With CA$5.39 share price, K92 Mining appears to be trading close to its estimated fair value
- Our fair value estimate is 42% lower than K92 Mining's analyst price target of US$10.70
In this article we are going to estimate the intrinsic value of K92 Mining Inc. (TSE:KNT) by taking the expected future cash flows and discounting them to their present value. The Discounted Cash Flow (DCF) model is the tool we will apply to do this. Models like these may appear beyond the comprehension of a lay person, but they're fairly easy to follow.
Remember though, that there are many ways to estimate a company's value, and a DCF is just one method. For those who are keen learners of equity analysis, the Simply Wall St analysis model here may be something of interest to you.
View our latest analysis for K92 Mining
The Model
We use what is known as a 2-stage model, which simply means we have two different periods of growth rates for the company's cash flows. Generally the first stage is higher growth, and the second stage is a lower growth phase. To start off with, we need to estimate the next ten years of cash flows. Where possible we use analyst estimates, but when these aren't available we extrapolate the previous free cash flow (FCF) from the last estimate or reported value. We assume companies with shrinking free cash flow will slow their rate of shrinkage, and that companies with growing free cash flow will see their growth rate slow, over this period. We do this to reflect that growth tends to slow more in the early years than it does in later years.
Generally we assume that a dollar today is more valuable than a dollar in the future, so we discount the value of these future cash flows to their estimated value in today's dollars:
10-year free cash flow (FCF) forecast
| 2024 | 2025 | 2026 | 2027 | 2028 | 2029 | 2030 | 2031 | 2032 | 2033 | |
| Levered FCF ($, Millions) | -US$62.8m | US$86.1m | US$191.4m | US$125.5m | US$92.5m | US$76.0m | US$67.0m | US$61.8m | US$58.7m | US$57.0m |
| Growth Rate Estimate Source | Analyst x9 | Analyst x7 | Analyst x2 | Analyst x1 | Est @ -26.26% | Est @ -17.82% | Est @ -11.92% | Est @ -7.78% | Est @ -4.89% | Est @ -2.87% |
| Present Value ($, Millions) Discounted @ 7.2% | -US$58.6 | US$75.0 | US$155 | US$95.0 | US$65.3 | US$50.1 | US$41.1 | US$35.4 | US$31.4 | US$28.5 |
("Est" = FCF growth rate estimated by Simply Wall St)
Present Value of 10-year Cash Flow (PVCF) = US$518m
After calculating the present value of future cash flows in the initial 10-year period, we need to calculate the Terminal Value, which accounts for all future cash flows beyond the first stage. The Gordon Growth formula is used to calculate Terminal Value at a future annual growth rate equal to the 5-year average of the 10-year government bond yield of 1.9%. We discount the terminal cash flows to today's value at a cost of equity of 7.2%.
Terminal Value (TV)= FCF2033 × (1 + g) ÷ (r – g) = US$57m× (1 + 1.9%) ÷ (7.2%– 1.9%) = US$1.1b
Present Value of Terminal Value (PVTV)= TV / (1 + r)10= US$1.1b÷ ( 1 + 7.2%)10= US$542m
The total value, or equity value, is then the sum of the present value of the future cash flows, which in this case is US$1.1b. To get the intrinsic value per share, we divide this by the total number of shares outstanding. Compared to the current share price of CA$5.4, the company appears about fair value at a 14% discount to where the stock price trades currently. Remember though, that this is just an approximate valuation, and like any complex formula - garbage in, garbage out.
The Assumptions
The calculation above is very dependent on two assumptions. The first is the discount rate and the other is the cash flows. If you don't agree with these result, have a go at the calculation yourself and play with the assumptions. The DCF also does not consider the possible cyclicality of an industry, or a company's future capital requirements, so it does not give a full picture of a company's potential performance. Given that we are looking at K92 Mining as potential shareholders, the cost of equity is used as the discount rate, rather than the cost of capital (or weighted average cost of capital, WACC) which accounts for debt. In this calculation we've used 7.2%, which is based on a levered beta of 1.069. Beta is a measure of a stock's volatility, compared to the market as a whole. We get our beta from the industry average beta of globally comparable companies, with an imposed limit between 0.8 and 2.0, which is a reasonable range for a stable business.
SWOT Analysis for K92 Mining
- Currently debt free.
- Earnings declined over the past year.
- Annual earnings are forecast to grow faster than the Canadian market.
- Current share price is below our estimate of fair value.
- No apparent threats visible for KNT.
Next Steps:
Valuation is only one side of the coin in terms of building your investment thesis, and it ideally won't be the sole piece of analysis you scrutinize for a company. It's not possible to obtain a foolproof valuation with a DCF model. Rather it should be seen as a guide to "what assumptions need to be true for this stock to be under/overvalued?" If a company grows at a different rate, or if its cost of equity or risk free rate changes sharply, the output can look very different. For K92 Mining, we've compiled three pertinent aspects you should look at:
- Risks: Every company has them, and we've spotted 1 warning sign for K92 Mining you should know about.
- Future Earnings: How does KNT's growth rate compare to its peers and the wider market? Dig deeper into the analyst consensus number for the upcoming years by interacting with our free analyst growth expectation chart.
- Other Solid Businesses: Low debt, high returns on equity and good past performance are fundamental to a strong business. Why not explore our interactive list of stocks with solid business fundamentals to see if there are other companies you may not have considered!
PS. The Simply Wall St app conducts a discounted cash flow valuation for every stock on the TSX every day. If you want to find the calculation for other stocks just search here.
Mobile Infrastructure for Defense and Disaster
The next wave in robotics isn't humanoid. Its fully autonomous towers delivering 5G, ISR, and radar in under 30 minutes, anywhere.
Get the investor briefing before the next round of contracts
Sponsored On Behalf of CiTechValuation is complex, but we're here to simplify it.
Discover if K92 Mining might be undervalued or overvalued with our detailed analysis, featuring fair value estimates, potential risks, dividends, insider trades, and its financial condition.
Access Free AnalysisHave feedback on this article? Concerned about the content? Get in touch with us directly. Alternatively, email editorial-team (at) simplywallst.com.
This article by Simply Wall St is general in nature. We provide commentary based on historical data and analyst forecasts only using an unbiased methodology and our articles are not intended to be financial advice. It does not constitute a recommendation to buy or sell any stock, and does not take account of your objectives, or your financial situation. We aim to bring you long-term focused analysis driven by fundamental data. Note that our analysis may not factor in the latest price-sensitive company announcements or qualitative material. Simply Wall St has no position in any stocks mentioned.
About TSX:KNT
K92 Mining
Engages in the exploration and development of mineral deposits in Papua New Guinea.
Undervalued with high growth potential.
Similar Companies
Market Insights

Weekly Picks

Early mover in a fast growing industry. Likely to experience share price volatility as they scale


A case for CA$31.80 (undiluted), aka 8,616% upside from CA$0.37 (an 86 bagger!).


Moderation and Stabilisation: HOLD: Fair Price based on a 4-year Cycle is $12.08
Recently Updated Narratives

Airbnb Stock: Platform Growth in a World of Saturation and Scrutiny

Clarivate Stock: When Data Becomes the Backbone of Innovation and Law

Adobe Stock: AI-Fueled ARR Growth Pushes Guidance Higher, But Cost Pressures Loom
Popular Narratives


Crazy Undervalued 42 Baggers Silver Play (Active & Running Mine)


NVDA: Expanding AI Demand Will Drive Major Data Center Investments Through 2026


MicroVision will explode future revenue by 380.37% with a vision towards success
Trending Discussion
