
Advertisement
- Canada
- /
- Metals and Mining
- /
- TSX:GTWO
Here's Why We're Watching G2 Goldfields' (TSE:GTWO) Cash Burn Situation
Just because a business does not make any money, does not mean that the stock will go down. For example, although software-as-a-service business Salesforce.com lost money for years while it grew recurring revenue, if you held shares since 2005, you'd have done very well indeed. But while the successes are well known, investors should not ignore the very many unprofitable companies that simply burn through all their cash and collapse.
So, the natural question for G2 Goldfields (TSE:GTWO) shareholders is whether they should be concerned by its rate of cash burn. For the purposes of this article, cash burn is the annual rate at which an unprofitable company spends cash to fund its growth; its negative free cash flow. First, we'll determine its cash runway by comparing its cash burn with its cash reserves.
Check out our latest analysis for G2 Goldfields
Does G2 Goldfields Have A Long Cash Runway?
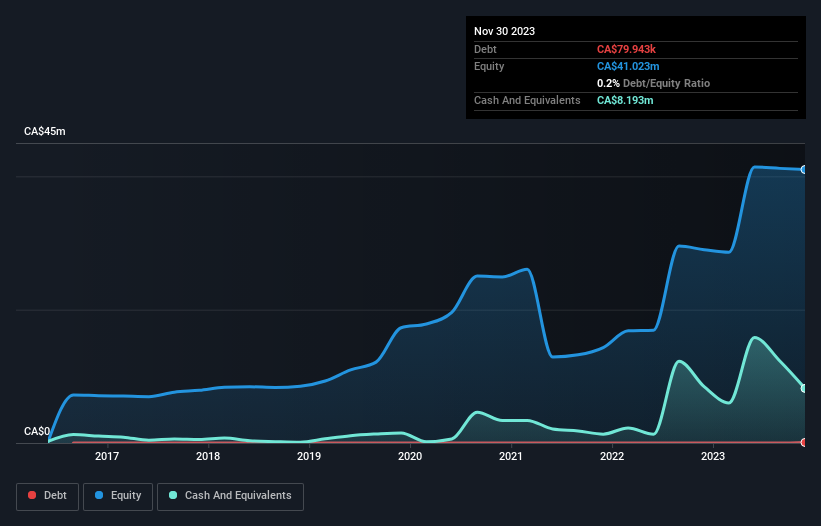
A cash runway is defined as the length of time it would take a company to run out of money if it kept spending at its current rate of cash burn. G2 Goldfields has such a small amount of debt that we'll set it aside, and focus on the CA$8.2m in cash it held at November 2023. Importantly, its cash burn was CA$13m over the trailing twelve months. Therefore, from November 2023 it had roughly 7 months of cash runway. Importantly, analysts think that G2 Goldfields will reach cashflow breakeven in 4 years. Essentially, that means the company will either reduce its cash burn, or else require more cash. Depicted below, you can see how its cash holdings have changed over time.
How Is G2 Goldfields' Cash Burn Changing Over Time?
Whilst it's great to see that G2 Goldfields has already begun generating revenue from operations, last year it only produced CA$364k, so we don't think it is generating significant revenue, at this point. Therefore, for the purposes of this analysis we'll focus on how the cash burn is tracking. Over the last year its cash burn actually increased by a very significant 52%. While this spending increase is no doubt intended to drive growth, if the trend continues the company's cash runway will shrink very quickly. Clearly, however, the crucial factor is whether the company will grow its business going forward. For that reason, it makes a lot of sense to take a look at our analyst forecasts for the company.
Can G2 Goldfields Raise More Cash Easily?
Given its cash burn trajectory, G2 Goldfields shareholders should already be thinking about how easy it might be for it to raise further cash in the future. Companies can raise capital through either debt or equity. Commonly, a business will sell new shares in itself to raise cash and drive growth. We can compare a company's cash burn to its market capitalisation to get a sense for how many new shares a company would have to issue to fund one year's operations.
G2 Goldfields' cash burn of CA$13m is about 5.0% of its CA$263m market capitalisation. Given that is a rather small percentage, it would probably be really easy for the company to fund another year's growth by issuing some new shares to investors, or even by taking out a loan.
So, Should We Worry About G2 Goldfields' Cash Burn?
On this analysis of G2 Goldfields' cash burn, we think its cash burn relative to its market cap was reassuring, while its cash runway has us a bit worried. Shareholders can take heart from the fact that analysts are forecasting it will reach breakeven. Summing up, we think the G2 Goldfields' cash burn is a risk, based on the factors we mentioned in this article. Taking a deeper dive, we've spotted 5 warning signs for G2 Goldfields you should be aware of, and 4 of them can't be ignored.
If you would prefer to check out another company with better fundamentals, then do not miss this free list of interesting companies, that have HIGH return on equity and low debt or this list of stocks which are all forecast to grow.
New: Manage All Your Stock Portfolios in One Place
We've created the ultimate portfolio companion for stock investors, and it's free.
• Connect an unlimited number of Portfolios and see your total in one currency
• Be alerted to new Warning Signs or Risks via email or mobile
• Track the Fair Value of your stocks
Have feedback on this article? Concerned about the content? Get in touch with us directly. Alternatively, email editorial-team (at) simplywallst.com.
This article by Simply Wall St is general in nature. We provide commentary based on historical data and analyst forecasts only using an unbiased methodology and our articles are not intended to be financial advice. It does not constitute a recommendation to buy or sell any stock, and does not take account of your objectives, or your financial situation. We aim to bring you long-term focused analysis driven by fundamental data. Note that our analysis may not factor in the latest price-sensitive company announcements or qualitative material. Simply Wall St has no position in any stocks mentioned.
About TSX:GTWO
G2 Goldfields
Engages in the acquisition and exploration of mineral properties.
Flawless balance sheet and slightly overvalued.
Similar Companies
Market Insights

Advertisement
Weekly Picks
FA

FAI on Arabian Internet and Communication Services ·
Solutions by stc: 34% Upside in Saudi's Digital Transformation Leader
Fair Value:ر.س342.2335.3% undervalued
9 followersusers have followed this narrative
1 commentusers have commented on this narrative
3 likesusers have liked this narrative
RO


RobertoAllende on NVIDIA ·
The AI Infrastructure Giant Grows Into Its Valuation
Fair Value:US$345.0747.9% undervalued
27 followersusers have followed this narrative
28 commentsusers have commented on this narrative
21 likesusers have liked this narrative
Recently Updated Narratives
AB
Abc on Global X Etfs Icav - Global X Silver Miners Ucits ETF ·
Many trends acting at the same time
Fair Value:€10068.5% undervalued
1 followerusers have followed this narrative
0 commentsusers have commented on this narrative
0 likesusers have liked this narrative
NI


niteco on Texas Instruments ·
Engineered for Stability. Positioned for Growth.
Fair Value:US$314.4446.5% undervalued
2 followersusers have followed this narrative
0 commentsusers have commented on this narrative
0 likesusers have liked this narrative
MA


MarkoVT on Applied Digital ·
Staggered by dilution; positions for growth
Fair Value:US$35.4520.4% undervalued
2 followersusers have followed this narrative
0 commentsusers have commented on this narrative
0 likesusers have liked this narrative
Popular Narratives
TH

TheWallstreetKing on MicroVision ·
MicroVision will explode future revenue by 380.37% with a vision towards success
Fair Value:US$6098.4% undervalued
109 followersusers have followed this narrative
11 commentsusers have commented on this narrative
22 likesusers have liked this narrative
AN

AnalystConsensusTarget on NVIDIA ·
NVDA: Expanding AI Demand Will Drive Major Data Center Investments Through 2026
Fair Value:US$250.3928.1% undervalued
939 followersusers have followed this narrative
6 commentsusers have commented on this narrative
24 likesusers have liked this narrative
OS


oscargarcia on Alphabet ·
The company that turned a verb into a global necessity and basically runs the modern internet, digital ads, smartphones, maps, and AI.
Fair Value:US$3407.4% undervalued
145 followersusers have followed this narrative
6 commentsusers have commented on this narrative
18 likesusers have liked this narrative