- Canada
- /
- Metals and Mining
- /
- TSX:FNV
Franco-Nevada Corporation (TSE:FNV) Shares Could Be 30% Above Their Intrinsic Value Estimate

Key Insights
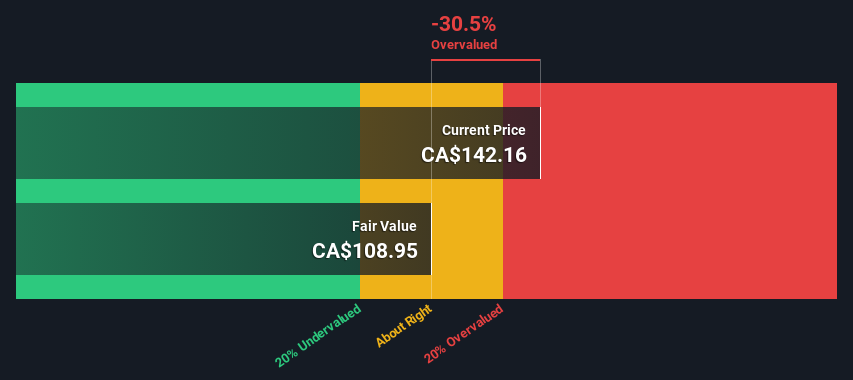
- Franco-Nevada's estimated fair value is CA$109 based on 2 Stage Free Cash Flow to Equity
- Current share price of CA$142 suggests Franco-Nevada is potentially 30% overvalued
- Our fair value estimate is 43% lower than Franco-Nevada's analyst price target of US$192
Does the February share price for Franco-Nevada Corporation (TSE:FNV) reflect what it's really worth? Today, we will estimate the stock's intrinsic value by taking the expected future cash flows and discounting them to today's value. We will take advantage of the Discounted Cash Flow (DCF) model for this purpose. Don't get put off by the jargon, the math behind it is actually quite straightforward.
Remember though, that there are many ways to estimate a company's value, and a DCF is just one method. If you still have some burning questions about this type of valuation, take a look at the Simply Wall St analysis model.
See our latest analysis for Franco-Nevada
Is Franco-Nevada Fairly Valued?
We're using the 2-stage growth model, which simply means we take in account two stages of company's growth. In the initial period the company may have a higher growth rate and the second stage is usually assumed to have a stable growth rate. To start off with, we need to estimate the next ten years of cash flows. Where possible we use analyst estimates, but when these aren't available we extrapolate the previous free cash flow (FCF) from the last estimate or reported value. We assume companies with shrinking free cash flow will slow their rate of shrinkage, and that companies with growing free cash flow will see their growth rate slow, over this period. We do this to reflect that growth tends to slow more in the early years than it does in later years.
Generally we assume that a dollar today is more valuable than a dollar in the future, so we need to discount the sum of these future cash flows to arrive at a present value estimate:
10-year free cash flow (FCF) estimate
| 2024 | 2025 | 2026 | 2027 | 2028 | 2029 | 2030 | 2031 | 2032 | 2033 | |
| Levered FCF ($, Millions) | US$921.9m | US$886.3m | US$869.1m | US$862.5m | US$863.0m | US$868.6m | US$877.7m | US$889.3m | US$902.9m | US$918.0m |
| Growth Rate Estimate Source | Analyst x5 | Analyst x2 | Est @ -1.94% | Est @ -0.76% | Est @ 0.06% | Est @ 0.64% | Est @ 1.05% | Est @ 1.33% | Est @ 1.53% | Est @ 1.67% |
| Present Value ($, Millions) Discounted @ 7.1% | US$861 | US$773 | US$708 | US$656 | US$613 | US$576 | US$544 | US$514 | US$488 | US$463 |
("Est" = FCF growth rate estimated by Simply Wall St)
Present Value of 10-year Cash Flow (PVCF) = US$6.2b
We now need to calculate the Terminal Value, which accounts for all the future cash flows after this ten year period. For a number of reasons a very conservative growth rate is used that cannot exceed that of a country's GDP growth. In this case we have used the 5-year average of the 10-year government bond yield (2.0%) to estimate future growth. In the same way as with the 10-year 'growth' period, we discount future cash flows to today's value, using a cost of equity of 7.1%.
Terminal Value (TV)= FCF2033 × (1 + g) ÷ (r – g) = US$918m× (1 + 2.0%) ÷ (7.1%– 2.0%) = US$18b
Present Value of Terminal Value (PVTV)= TV / (1 + r)10= US$18b÷ ( 1 + 7.1%)10= US$9.3b
The total value, or equity value, is then the sum of the present value of the future cash flows, which in this case is US$15b. The last step is to then divide the equity value by the number of shares outstanding. Compared to the current share price of CA$142, the company appears potentially overvalued at the time of writing. Remember though, that this is just an approximate valuation, and like any complex formula - garbage in, garbage out.
The Assumptions
We would point out that the most important inputs to a discounted cash flow are the discount rate and of course the actual cash flows. If you don't agree with these result, have a go at the calculation yourself and play with the assumptions. The DCF also does not consider the possible cyclicality of an industry, or a company's future capital requirements, so it does not give a full picture of a company's potential performance. Given that we are looking at Franco-Nevada as potential shareholders, the cost of equity is used as the discount rate, rather than the cost of capital (or weighted average cost of capital, WACC) which accounts for debt. In this calculation we've used 7.1%, which is based on a levered beta of 1.107. Beta is a measure of a stock's volatility, compared to the market as a whole. We get our beta from the industry average beta of globally comparable companies, with an imposed limit between 0.8 and 2.0, which is a reasonable range for a stable business.
SWOT Analysis for Franco-Nevada
- Currently debt free.
- Dividends are covered by earnings and cash flows.
- Earnings declined over the past year.
- Dividend is low compared to the top 25% of dividend payers in the Metals and Mining market.
- Expensive based on P/E ratio and estimated fair value.
- FNV's financial characteristics indicate limited near-term opportunities for shareholders.
- Annual earnings are forecast to decline for the next 3 years.
Moving On:
Although the valuation of a company is important, it shouldn't be the only metric you look at when researching a company. DCF models are not the be-all and end-all of investment valuation. Rather it should be seen as a guide to "what assumptions need to be true for this stock to be under/overvalued?" For example, changes in the company's cost of equity or the risk free rate can significantly impact the valuation. What is the reason for the share price exceeding the intrinsic value? For Franco-Nevada, we've put together three further factors you should further research:
- Risks: As an example, we've found 1 warning sign for Franco-Nevada that you need to consider before investing here.
- Future Earnings: How does FNV's growth rate compare to its peers and the wider market? Dig deeper into the analyst consensus number for the upcoming years by interacting with our free analyst growth expectation chart.
- Other Solid Businesses: Low debt, high returns on equity and good past performance are fundamental to a strong business. Why not explore our interactive list of stocks with solid business fundamentals to see if there are other companies you may not have considered!
PS. Simply Wall St updates its DCF calculation for every Canadian stock every day, so if you want to find the intrinsic value of any other stock just search here.
New: AI Stock Screener & Alerts
Our new AI Stock Screener scans the market every day to uncover opportunities.
• Dividend Powerhouses (3%+ Yield)
• Undervalued Small Caps with Insider Buying
• High growth Tech and AI Companies
Or build your own from over 50 metrics.
Have feedback on this article? Concerned about the content? Get in touch with us directly. Alternatively, email editorial-team (at) simplywallst.com.
This article by Simply Wall St is general in nature. We provide commentary based on historical data and analyst forecasts only using an unbiased methodology and our articles are not intended to be financial advice. It does not constitute a recommendation to buy or sell any stock, and does not take account of your objectives, or your financial situation. We aim to bring you long-term focused analysis driven by fundamental data. Note that our analysis may not factor in the latest price-sensitive company announcements or qualitative material. Simply Wall St has no position in any stocks mentioned.
About TSX:FNV
Franco-Nevada
Operates as a gold-focused royalty and streaming company in South America, Central America, Mexico, the United States, Canada, and internationally.
Flawless balance sheet with reasonable growth potential.
