Stock Analysis
- Canada
- /
- Metals and Mining
- /
- TSX:ABX
Barrick Gold (TSE:ABX) shareholder returns have been decent, earning 74% in 5 years


Generally speaking the aim of active stock picking is to find companies that provide returns that are superior to the market average. And in our experience, buying the right stocks can give your wealth a significant boost. To wit, the Barrick Gold share price has climbed 53% in five years, easily topping the market return of 38% (ignoring dividends). On the other hand, the more recent gains haven't been so impressive, with shareholders gaining just 3.9%, including dividends.
The past week has proven to be lucrative for Barrick Gold investors, so let's see if fundamentals drove the company's five-year performance.
Check out our latest analysis for Barrick Gold
While the efficient markets hypothesis continues to be taught by some, it has been proven that markets are over-reactive dynamic systems, and investors are not always rational. By comparing earnings per share (EPS) and share price changes over time, we can get a feel for how investor attitudes to a company have morphed over time.
During the five years of share price growth, Barrick Gold moved from a loss to profitability. That would generally be considered a positive, so we'd hope to see the share price to rise.
The graphic below depicts how EPS has changed over time (unveil the exact values by clicking on the image).
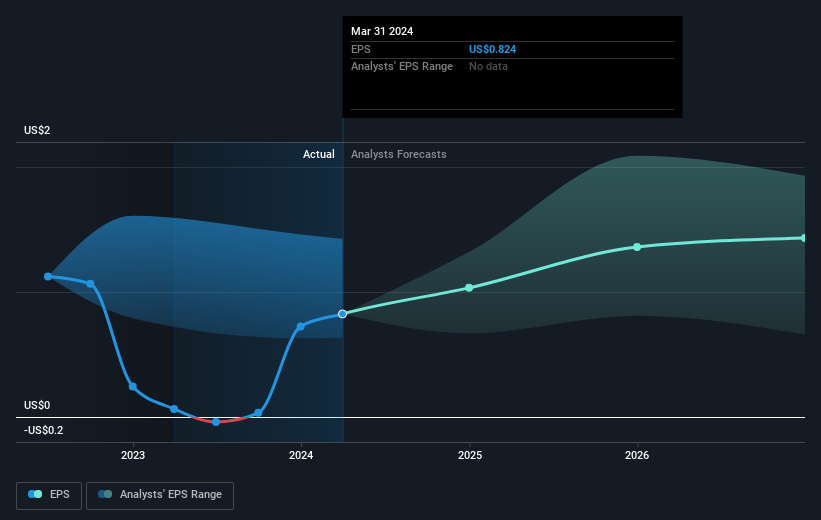
It's good to see that there was some significant insider buying in the last three months. That's a positive. That said, we think earnings and revenue growth trends are even more important factors to consider. Before buying or selling a stock, we always recommend a close examination of historic growth trends, available here..
What About Dividends?
As well as measuring the share price return, investors should also consider the total shareholder return (TSR). Whereas the share price return only reflects the change in the share price, the TSR includes the value of dividends (assuming they were reinvested) and the benefit of any discounted capital raising or spin-off. Arguably, the TSR gives a more comprehensive picture of the return generated by a stock. In the case of Barrick Gold, it has a TSR of 74% for the last 5 years. That exceeds its share price return that we previously mentioned. This is largely a result of its dividend payments!
A Different Perspective
Barrick Gold shareholders are up 3.9% for the year (even including dividends). But that return falls short of the market. It's probably a good sign that the company has an even better long term track record, having provided shareholders with an annual TSR of 12% over five years. It may well be that this is a business worth popping on the watching, given the continuing positive reception, over time, from the market. I find it very interesting to look at share price over the long term as a proxy for business performance. But to truly gain insight, we need to consider other information, too. Case in point: We've spotted 1 warning sign for Barrick Gold you should be aware of.
If you like to buy stocks alongside management, then you might just love this free list of companies. (Hint: most of them are flying under the radar).
Please note, the market returns quoted in this article reflect the market weighted average returns of stocks that currently trade on Canadian exchanges.
Valuation is complex, but we're helping make it simple.
Find out whether Barrick Gold is potentially over or undervalued by checking out our comprehensive analysis, which includes fair value estimates, risks and warnings, dividends, insider transactions and financial health.
View the Free AnalysisHave feedback on this article? Concerned about the content? Get in touch with us directly. Alternatively, email editorial-team (at) simplywallst.com.
This article by Simply Wall St is general in nature. We provide commentary based on historical data and analyst forecasts only using an unbiased methodology and our articles are not intended to be financial advice. It does not constitute a recommendation to buy or sell any stock, and does not take account of your objectives, or your financial situation. We aim to bring you long-term focused analysis driven by fundamental data. Note that our analysis may not factor in the latest price-sensitive company announcements or qualitative material. Simply Wall St has no position in any stocks mentioned.
About TSX:ABX
Barrick Gold
Engages in the exploration, mine development, production, and sale of gold and copper properties in Canada and internationally.
Undervalued with solid track record.
