Power Corporation of Canada's (TSE:POW) investors will be pleased with their favorable 100% return over the last five years


When we invest, we're generally looking for stocks that outperform the market average. Buying under-rated businesses is one path to excess returns. For example, long term Power Corporation of Canada (TSE:POW) shareholders have enjoyed a 47% share price rise over the last half decade, well in excess of the market return of around 35% (not including dividends). However, more recent returns haven't been as impressive as that, with the stock returning just 14% in the last year , including dividends .
With that in mind, it's worth seeing if the company's underlying fundamentals have been the driver of long term performance, or if there are some discrepancies.
View our latest analysis for Power Corporation of Canada
In his essay The Superinvestors of Graham-and-Doddsville Warren Buffett described how share prices do not always rationally reflect the value of a business. One imperfect but simple way to consider how the market perception of a company has shifted is to compare the change in the earnings per share (EPS) with the share price movement.
During five years of share price growth, Power Corporation of Canada actually saw its EPS drop 0.7% per year.
By glancing at these numbers, we'd posit that the decline in earnings per share is not representative of how the business has changed over the years. Since the change in EPS doesn't seem to correlate with the change in share price, it's worth taking a look at other metrics.
We note that the dividend is higher than it was previously - always nice to see. It could be that the company is reaching maturity and dividend investors are buying for the yield.
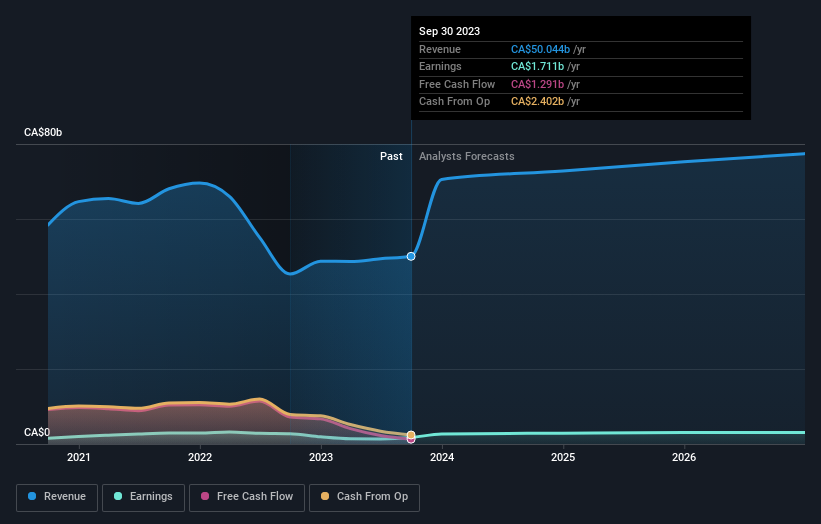
You can see how earnings and revenue have changed over time in the image below (click on the chart to see the exact values).
It's probably worth noting we've seen significant insider buying in the last quarter, which we consider a positive. On the other hand, we think the revenue and earnings trends are much more meaningful measures of the business. So we recommend checking out this free report showing consensus forecasts
What About Dividends?
As well as measuring the share price return, investors should also consider the total shareholder return (TSR). Whereas the share price return only reflects the change in the share price, the TSR includes the value of dividends (assuming they were reinvested) and the benefit of any discounted capital raising or spin-off. So for companies that pay a generous dividend, the TSR is often a lot higher than the share price return. As it happens, Power Corporation of Canada's TSR for the last 5 years was 100%, which exceeds the share price return mentioned earlier. The dividends paid by the company have thusly boosted the total shareholder return.
A Different Perspective
We're pleased to report that Power Corporation of Canada shareholders have received a total shareholder return of 14% over one year. That's including the dividend. However, that falls short of the 15% TSR per annum it has made for shareholders, each year, over five years. It's always interesting to track share price performance over the longer term. But to understand Power Corporation of Canada better, we need to consider many other factors. Case in point: We've spotted 2 warning signs for Power Corporation of Canada you should be aware of.
Power Corporation of Canada is not the only stock insiders are buying. So take a peek at this free list of growing companies with insider buying.
Please note, the market returns quoted in this article reflect the market weighted average returns of stocks that currently trade on Canadian exchanges.
New: Manage All Your Stock Portfolios in One Place
We've created the ultimate portfolio companion for stock investors, and it's free.
• Connect an unlimited number of Portfolios and see your total in one currency
• Be alerted to new Warning Signs or Risks via email or mobile
• Track the Fair Value of your stocks
Have feedback on this article? Concerned about the content? Get in touch with us directly. Alternatively, email editorial-team (at) simplywallst.com.
This article by Simply Wall St is general in nature. We provide commentary based on historical data and analyst forecasts only using an unbiased methodology and our articles are not intended to be financial advice. It does not constitute a recommendation to buy or sell any stock, and does not take account of your objectives, or your financial situation. We aim to bring you long-term focused analysis driven by fundamental data. Note that our analysis may not factor in the latest price-sensitive company announcements or qualitative material. Simply Wall St has no position in any stocks mentioned.
About TSX:POW
Power Corporation of Canada
An international management and holding company, offers financial services in North America, Europe, and Asia.
Undervalued with excellent balance sheet and pays a dividend.

