- Canada
- /
- Healthtech
- /
- TSXV:KDA
More Unpleasant Surprises Could Be In Store For KDA Group Inc.'s (CVE:KDA) Shares After Tumbling 28%

KDA Group Inc. (CVE:KDA) shareholders won't be pleased to see that the share price has had a very rough month, dropping 28% and undoing the prior period's positive performance. Instead of being rewarded, shareholders who have already held through the last twelve months are now sitting on a 32% share price drop.
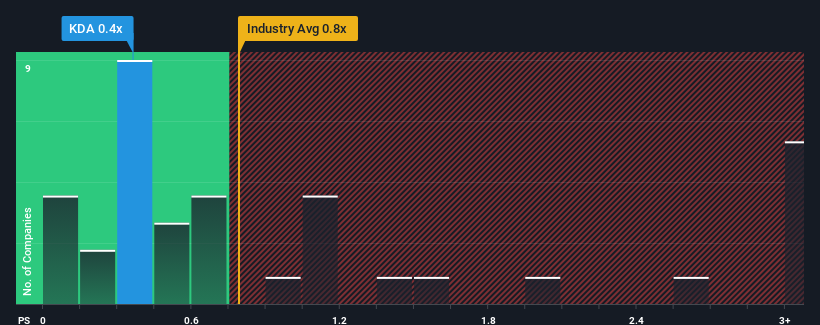
Even after such a large drop in price, there still wouldn't be many who think KDA Group's price-to-sales (or "P/S") ratio of 0.4x is worth a mention when the median P/S in Canada's Healthcare industry is similar at about 0.8x. While this might not raise any eyebrows, if the P/S ratio is not justified investors could be missing out on a potential opportunity or ignoring looming disappointment.
View our latest analysis for KDA Group
How KDA Group Has Been Performing
KDA Group certainly has been doing a great job lately as it's been growing its revenue at a really rapid pace. The P/S is probably moderate because investors think this strong revenue growth might not be enough to outperform the broader industry in the near future. If that doesn't eventuate, then existing shareholders have reason to be feeling optimistic about the future direction of the share price.
Although there are no analyst estimates available for KDA Group, take a look at this free data-rich visualisation to see how the company stacks up on earnings, revenue and cash flow.How Is KDA Group's Revenue Growth Trending?
In order to justify its P/S ratio, KDA Group would need to produce growth that's similar to the industry.
If we review the last year of revenue growth, we see the company's revenues grew exponentially. Revenue has also lifted 18% in aggregate from three years ago, mostly thanks to the incredible last 12 months of growth. Accordingly, shareholders would have probably been satisfied with the medium-term rates of revenue growth, although potentially wondering why there's so much variation in revenue growth.
This is in contrast to the rest of the industry, which is expected to grow by 18% over the next year, materially higher than the company's recent medium-term annualised growth rates.
With this information, we find it interesting that KDA Group is trading at a fairly similar P/S compared to the industry. It seems most investors are ignoring the fairly limited recent growth rates and are willing to pay up for exposure to the stock. Maintaining these prices will be difficult to achieve as a continuation of recent revenue trends is likely to weigh down the shares eventually.
The Key Takeaway
KDA Group's plummeting stock price has brought its P/S back to a similar region as the rest of the industry. We'd say the price-to-sales ratio's power isn't primarily as a valuation instrument but rather to gauge current investor sentiment and future expectations.
We've established that KDA Group's average P/S is a bit surprising since its recent three-year growth is lower than the wider industry forecast. When we see weak revenue with slower than industry growth, we suspect the share price is at risk of declining, bringing the P/S back in line with expectations. Unless there is a significant improvement in the company's medium-term performance, it will be difficult to prevent the P/S ratio from declining to a more reasonable level.
You should always think about risks. Case in point, we've spotted 4 warning signs for KDA Group you should be aware of, and 3 of them are a bit concerning.
If these risks are making you reconsider your opinion on KDA Group, explore our interactive list of high quality stocks to get an idea of what else is out there.
Mobile Infrastructure for Defense and Disaster
The next wave in robotics isn't humanoid. Its fully autonomous towers delivering 5G, ISR, and radar in under 30 minutes, anywhere.
Get the investor briefing before the next round of contracts
Sponsored On Behalf of CiTechValuation is complex, but we're here to simplify it.
Discover if KDA Group might be undervalued or overvalued with our detailed analysis, featuring fair value estimates, potential risks, dividends, insider trades, and its financial condition.
Access Free AnalysisHave feedback on this article? Concerned about the content? Get in touch with us directly. Alternatively, email editorial-team (at) simplywallst.com.
This article by Simply Wall St is general in nature. We provide commentary based on historical data and analyst forecasts only using an unbiased methodology and our articles are not intended to be financial advice. It does not constitute a recommendation to buy or sell any stock, and does not take account of your objectives, or your financial situation. We aim to bring you long-term focused analysis driven by fundamental data. Note that our analysis may not factor in the latest price-sensitive company announcements or qualitative material. Simply Wall St has no position in any stocks mentioned.
About TSXV:KDA
KDA Group
Provides technological and operational efficiency solutions for both the general and specialized health sectors in Canada.
Slight risk with mediocre balance sheet.
Market Insights

Weekly Picks

THE KINGDOM OF BROWN GOODS: WHY MGPI IS BEING CRUSHED BY INVENTORY & PRIMED FOR RESURRECTION


Why Vertical Aerospace (NYSE: EVTL) is Worth Possibly Over 13x its Current Price


The Quiet Giant That Became AI’s Power Grid
Recently Updated Narratives

Butler National (Buks) outperforms.


A tech powerhouse quietly powering the world’s AI infrastructure.


Keppel DC REIT (SGX: AJBU) is a resilient gem in the data center space.
Popular Narratives

MicroVision will explode future revenue by 380.37% with a vision towards success


Crazy Undervalued 42 Baggers Silver Play (Active & Running Mine)


