- Canada
- /
- Oil and Gas
- /
- TSX:VET
Vermilion Energy (TSE:VET) pulls back 5.6% this week, but still delivers shareholders respectable 18% CAGR over 3 years


While Vermilion Energy Inc. (TSE:VET) shareholders are probably generally happy, the stock hasn't had particularly good run recently, with the share price falling 14% in the last quarter. But that doesn't change the fact that the returns over the last three years have been pleasing. To wit, the share price did better than an index fund, climbing 55% during that period.
In light of the stock dropping 5.6% in the past week, we want to investigate the longer term story, and see if fundamentals have been the driver of the company's positive three-year return.
See our latest analysis for Vermilion Energy
There is no denying that markets are sometimes efficient, but prices do not always reflect underlying business performance. One flawed but reasonable way to assess how sentiment around a company has changed is to compare the earnings per share (EPS) with the share price.
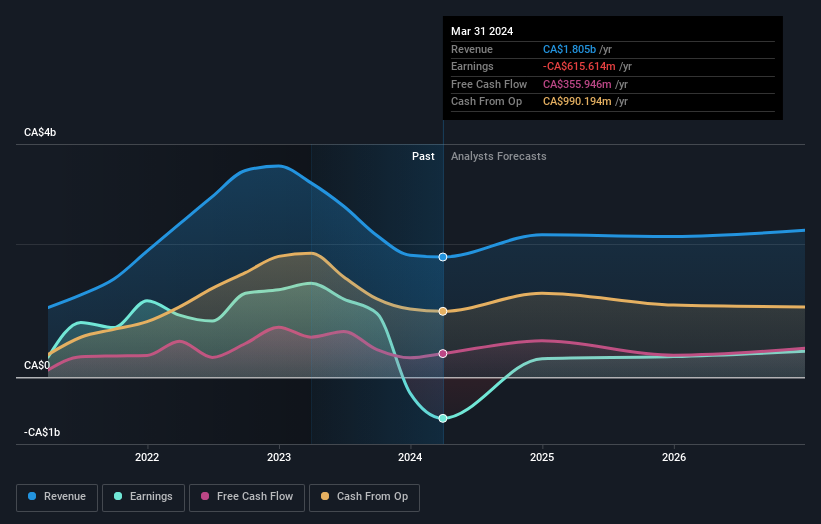
During the three years of share price growth, Vermilion Energy actually saw its earnings per share (EPS) drop 21% per year.
Thus, it seems unlikely that the market is focussed on EPS growth at the moment. Therefore, we think it's worth considering other metrics as well.
It could be that the revenue growth of 14% per year is viewed as evidence that Vermilion Energy is growing. In that case, the company may be sacrificing current earnings per share to drive growth, and maybe shareholder's faith in better days ahead will be rewarded.
You can see how earnings and revenue have changed over time in the image below (click on the chart to see the exact values).
We like that insiders have been buying shares in the last twelve months. Even so, future earnings will be far more important to whether current shareholders make money. So we recommend checking out this free report showing consensus forecasts
What About Dividends?
It is important to consider the total shareholder return, as well as the share price return, for any given stock. The TSR incorporates the value of any spin-offs or discounted capital raisings, along with any dividends, based on the assumption that the dividends are reinvested. It's fair to say that the TSR gives a more complete picture for stocks that pay a dividend. As it happens, Vermilion Energy's TSR for the last 3 years was 63%, which exceeds the share price return mentioned earlier. The dividends paid by the company have thusly boosted the total shareholder return.
A Different Perspective
While the broader market gained around 15% in the last year, Vermilion Energy shareholders lost 16% (even including dividends). However, keep in mind that even the best stocks will sometimes underperform the market over a twelve month period. Regrettably, last year's performance caps off a bad run, with the shareholders facing a total loss of 6% per year over five years. Generally speaking long term share price weakness can be a bad sign, though contrarian investors might want to research the stock in hope of a turnaround. I find it very interesting to look at share price over the long term as a proxy for business performance. But to truly gain insight, we need to consider other information, too. Case in point: We've spotted 2 warning signs for Vermilion Energy you should be aware of.
Vermilion Energy is not the only stock insiders are buying. So take a peek at this free list of small cap companies at attractive valuations which insiders have been buying.
Please note, the market returns quoted in this article reflect the market weighted average returns of stocks that currently trade on Canadian exchanges.
New: Manage All Your Stock Portfolios in One Place
We've created the ultimate portfolio companion for stock investors, and it's free.
• Connect an unlimited number of Portfolios and see your total in one currency
• Be alerted to new Warning Signs or Risks via email or mobile
• Track the Fair Value of your stocks
Have feedback on this article? Concerned about the content? Get in touch with us directly. Alternatively, email editorial-team (at) simplywallst.com.
This article by Simply Wall St is general in nature. We provide commentary based on historical data and analyst forecasts only using an unbiased methodology and our articles are not intended to be financial advice. It does not constitute a recommendation to buy or sell any stock, and does not take account of your objectives, or your financial situation. We aim to bring you long-term focused analysis driven by fundamental data. Note that our analysis may not factor in the latest price-sensitive company announcements or qualitative material. Simply Wall St has no position in any stocks mentioned.
Have feedback on this article? Concerned about the content? Get in touch with us directly. Alternatively, email editorial-team@simplywallst.com
About TSX:VET
Vermilion Energy
Engages in the acquisition, exploration, development, and production of petroleum and natural gas.
Good value with adequate balance sheet.

