- Canada
- /
- Oil and Gas
- /
- TSX:PMT
Key Things To Understand About Perpetual Energy's (TSE:PMT) CEO Pay Cheque

This article will reflect on the compensation paid to Sue Rose who has served as CEO of Perpetual Energy Inc. (TSE:PMT) since 2005. This analysis will also look to assess whether the CEO is appropriately paid, considering recent earnings growth and investor returns for Perpetual Energy.
View our latest analysis for Perpetual Energy
Comparing Perpetual Energy Inc.'s CEO Compensation With the industry
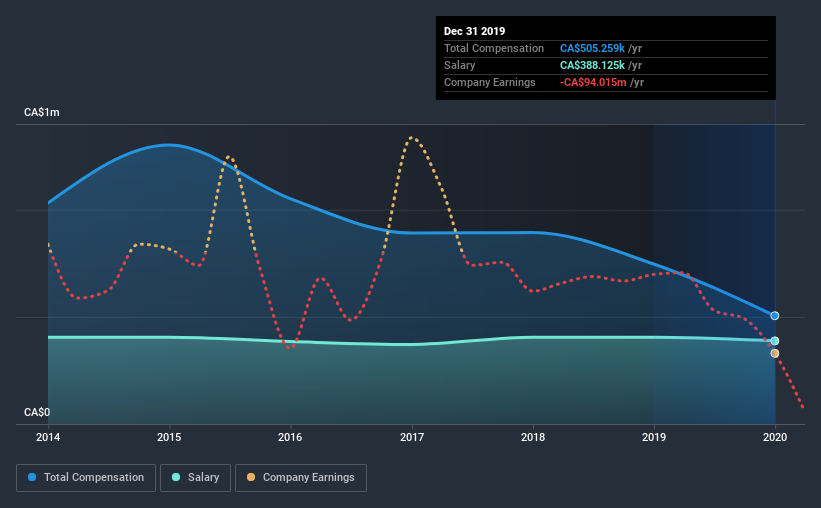
At the time of writing, our data shows that Perpetual Energy Inc. has a market capitalization of CA$5.8m, and reported total annual CEO compensation of CA$505k for the year to December 2019. That's a notable decrease of 32% on last year. Notably, the salary which is CA$388.1k, represents most of the total compensation being paid.
For comparison, other companies in the industry with market capitalizations below CA$272m, reported a median total CEO compensation of CA$377k. Accordingly, our analysis reveals that Perpetual Energy Inc. pays Sue Rose north of the industry median. What's more, Sue Rose holds CA$286k worth of shares in the company in their own name.
| Component | 2019 | 2018 | Proportion (2019) |
| Salary | CA$388k | CA$405k | 77% |
| Other | CA$117k | CA$342k | 23% |
| Total Compensation | CA$505k | CA$747k | 100% |
On an industry level, roughly 44% of total compensation represents salary and 56% is other remuneration. Perpetual Energy pays out 77% of remuneration in the form of a salary, significantly higher than the industry average. If total compensation veers towards salary, it suggests that the variable portion - which is generally tied to performance, is lower.

Perpetual Energy Inc.'s Growth
Over the last three years, Perpetual Energy Inc. has shrunk its earnings per share by 92% per year. Its revenue is down 30% over the previous year.
Few shareholders would be pleased to read that earnings have declined. This is compounded by the fact revenue is actually down on last year. These factors suggest that the business performance wouldn't really justify a high pay packet for the CEO. Historical performance can sometimes be a good indicator on what's coming up next but if you want to peer into the company's future you might be interested in this free visualization of analyst forecasts.
Has Perpetual Energy Inc. Been A Good Investment?
Given the total shareholder loss of 93% over three years, many shareholders in Perpetual Energy Inc. are probably rather dissatisfied, to say the least. So shareholders would probably want the company to be lessto generous with CEO compensation.
To Conclude...
As we noted earlier, Perpetual Energy pays its CEO higher than the norm for similar-sized companies belonging to the same industry. This doesn't look good against shareholder returns, which have been negative for the past three years. To make matters worse, earnings growth has also been negative during this period. Considering such poor performance, we think shareholders might be concerned if the CEO's compensation were to grow.
It is always advisable to analyse CEO pay, along with performing a thorough analysis of the company's key performance areas. In our study, we found 3 warning signs for Perpetual Energy you should be aware of, and 2 of them are concerning.
Important note: Perpetual Energy is an exciting stock, but we understand investors may be looking for an unencumbered balance sheet and blockbuster returns. You might find something better in this list of interesting companies with high ROE and low debt.
When trading Perpetual Energy or any other investment, use the platform considered by many to be the Professional's Gateway to the Worlds Market, Interactive Brokers. You get the lowest-cost* trading on stocks, options, futures, forex, bonds and funds worldwide from a single integrated account.Promoted
New: Manage All Your Stock Portfolios in One Place
We've created the ultimate portfolio companion for stock investors, and it's free.
• Connect an unlimited number of Portfolios and see your total in one currency
• Be alerted to new Warning Signs or Risks via email or mobile
• Track the Fair Value of your stocks
This article by Simply Wall St is general in nature. It does not constitute a recommendation to buy or sell any stock, and does not take account of your objectives, or your financial situation. We aim to bring you long-term focused analysis driven by fundamental data. Note that our analysis may not factor in the latest price-sensitive company announcements or qualitative material. Simply Wall St has no position in any stocks mentioned.
*Interactive Brokers Rated Lowest Cost Broker by StockBrokers.com Annual Online Review 2020
Have feedback on this article? Concerned about the content? Get in touch with us directly. Alternatively, email editorial-team@simplywallst.com.
About TSX:PMT
Perpetual Energy
Engages in the exploration, production, and marketing of oil and natural gas in Canada.
Mediocre balance sheet and slightly overvalued.
Market Insights
Community Narratives


