Advertisement
- Canada
- /
- Oil and Gas
- /
- TSX:ENB
Is Now the Right Moment to Reassess Enbridge Stock After Its 25% Climb?

Simply Wall St
Reviewed by Bailey Pemberton
Trying to decide what to do with Enbridge stock right now? You are not alone. Whether you have held shares through the pipeline giant’s steady climb over the last few years or are just now weighing a position, figuring out if Enbridge is over- or under-valued can feel a bit like a guessing game. The stock just finished trading at $66.77, and while it is down 4.5% in the last week, it has actually returned an impressive 25.3% over the past year and a massive 140.4% over five years. That long-term growth is tough to ignore, even if there are short-term jitters in the market.
Recent movements in Enbridge’s price have partly been fueled by broader market swings and shifting investor sentiment around North American energy infrastructure. With steady demand for oil and gas transit and ongoing debate over the energy transition, investors have reacted to both optimism about pipeline reliability and shifting concerns around regulation and future-proofing. These factors have contributed to some price volatility but also keep growth potential firmly in the spotlight.
So where does that leave Enbridge’s valuation? According to our checks, the company is currently undervalued in 2 out of 6 traditional valuation measures, earning a value score of 2. It is not the strongest signal of a bargain, but it is definitely not a warning sign either. Let us dig into how these valuation approaches work, why they matter, and most importantly, why there might be an even better way to look at Enbridge’s true worth before making your next move.
Enbridge scores just 2/6 on our valuation checks. See what other red flags we found in the full valuation breakdown.
Approach 1: Enbridge Discounted Cash Flow (DCF) Analysis
The Discounted Cash Flow (DCF) model is a popular valuation approach that estimates the present value of a company by projecting its future cash flows and discounting them back to today’s dollars. For Enbridge, this means evaluating how much cash the business is expected to generate over the coming years and then considering risk, time, and other factors to determine a fair value for the stock.
Currently, Enbridge reports Free Cash Flow (FCF) of CA$5.35 billion for the last twelve months. Analysts forecast steady growth, with estimates reaching CA$13.21 billion by 2029. Since most analyst projections only cover the next five years, cash flows beyond that period are extrapolated using industry forecasts and growth estimates.
Using the DCF model, the analysis calculates an intrinsic value of CA$184.44 per share. With Enbridge’s share price currently at CA$66.77, the DCF indicates that Enbridge is trading at a 63.8% discount to its estimated fair value, suggesting significant undervaluation based on these long-term cash flow projections.
Result: UNDERVALUED
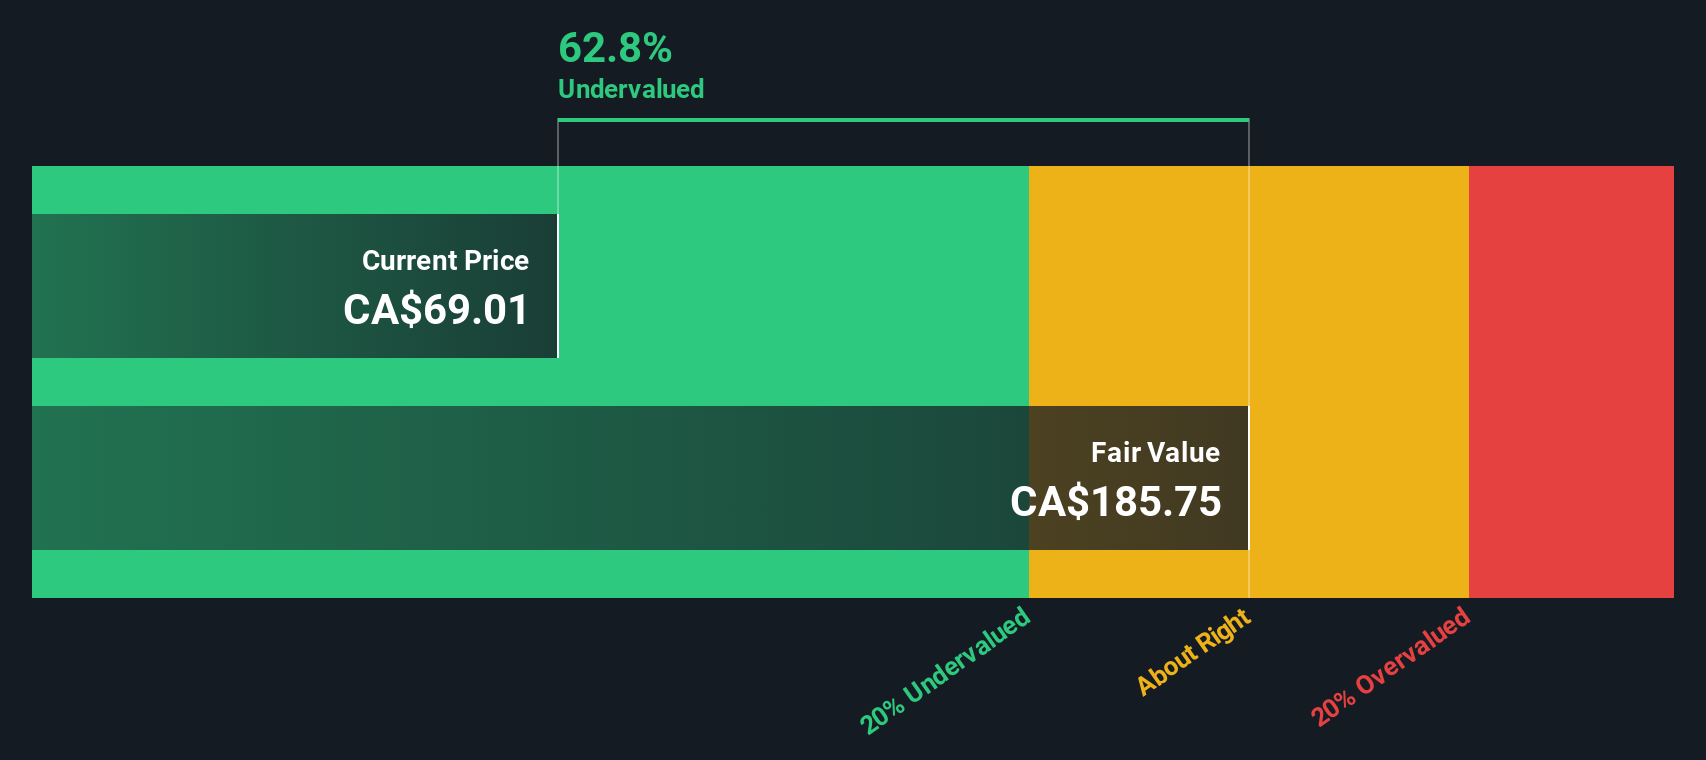
Our Discounted Cash Flow (DCF) analysis suggests Enbridge is undervalued by 63.8%. Track this in your watchlist or portfolio, or discover more undervalued stocks.
Approach 2: Enbridge Price vs Earnings (PE Ratio)
The Price-to-Earnings (PE) ratio is a staple valuation tool for profitable companies like Enbridge, as it measures how much investors are willing to pay for each dollar of a company’s earnings. This ratio is especially useful because it gives direct insight into market expectations for future growth and risk, two factors that heavily influence what is considered a “normal” or “fair” PE. High-growth, lower-risk companies generally command higher PE multiples. Companies with limited growth or higher uncertainties trade at lower multiples.
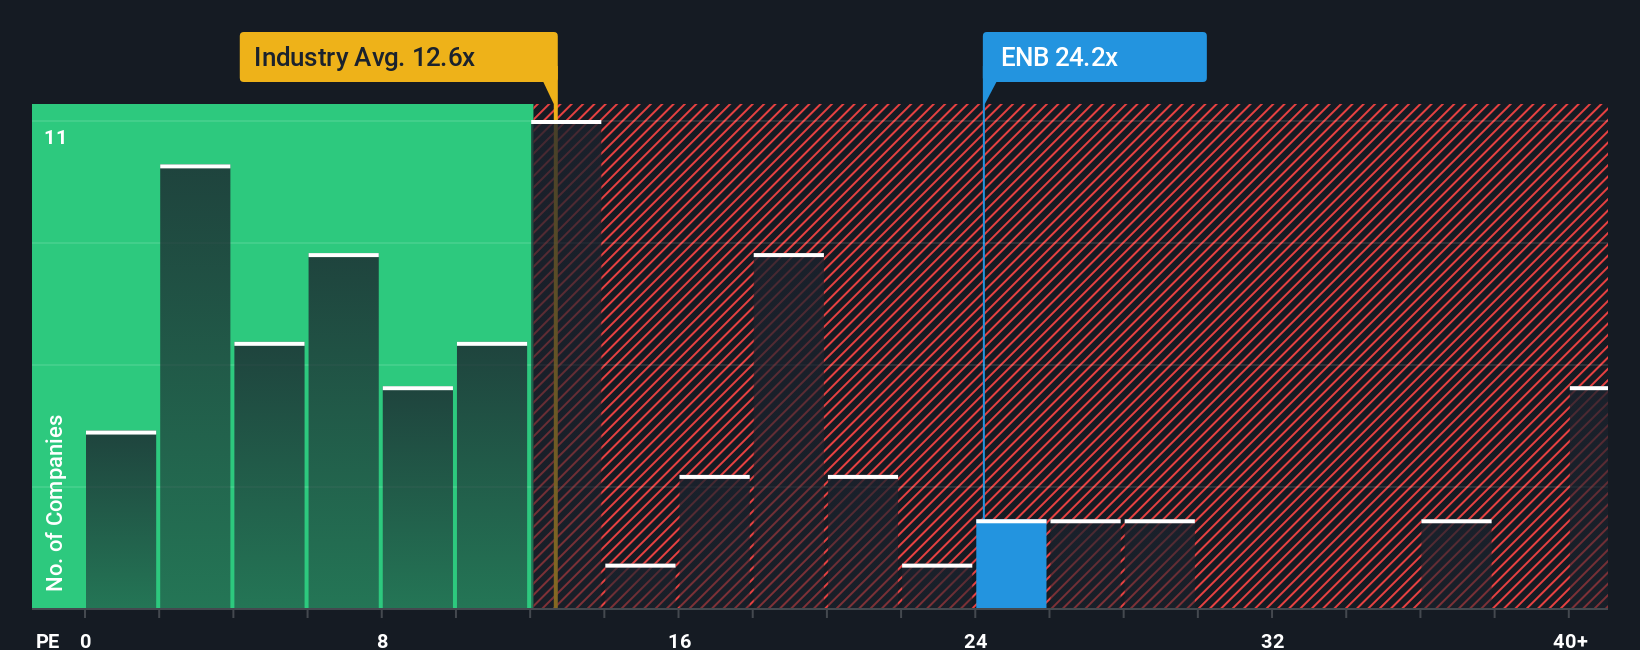
Currently, Enbridge trades at a PE ratio of 23.4x. When compared to the broader Oil and Gas industry average of 12.3x and the peer group average of 18.6x, Enbridge does appear a bit pricier. However, these benchmarks alone do not capture the full picture.
This is where Simply Wall St’s proprietary “Fair Ratio” comes in. The Fair Ratio, in this case 17.8x, reflects where Enbridge’s PE should sit based on its unique blend of earnings growth, profit margins, risk factors, size, and sector dynamics. Unlike a simple peer or industry comparison, the Fair Ratio weighs these important specifics rather than lumping all companies together.
Comparing Enbridge’s current PE multiple of 23.4x to its Fair Ratio of 17.8x, the stock looks to be trading above its fair value based on earnings. With a difference of more than 0.10 between the two, the numbers point to Enbridge being somewhat overvalued on this measure.
Result: OVERVALUED
PE ratios tell one story, but what if the real opportunity lies elsewhere? Discover companies where insiders are betting big on explosive growth.
Upgrade Your Decision Making: Choose your Enbridge Narrative
Earlier we mentioned that there is an even better way to understand valuation. Let us introduce you to Narratives. A Narrative is simply your perspective on a company’s story, captured through your own assumptions about its future revenue, profit margins, and growth, all tied directly to an estimated fair value. Narratives make your outlook tangible, allowing you to connect what you believe about Enbridge’s future to a dynamic forecast and a fair price, instead of relying solely on traditional metrics like the PE ratio.
This approach is designed to be accessible and easy for any investor, with tools available right inside Simply Wall St’s Community page, used by millions worldwide. Narratives help you make buy or sell decisions by comparing the Fair Value from your story to Enbridge’s current trading price, with everything updating in real time as new news, earnings, or corporate actions come in.
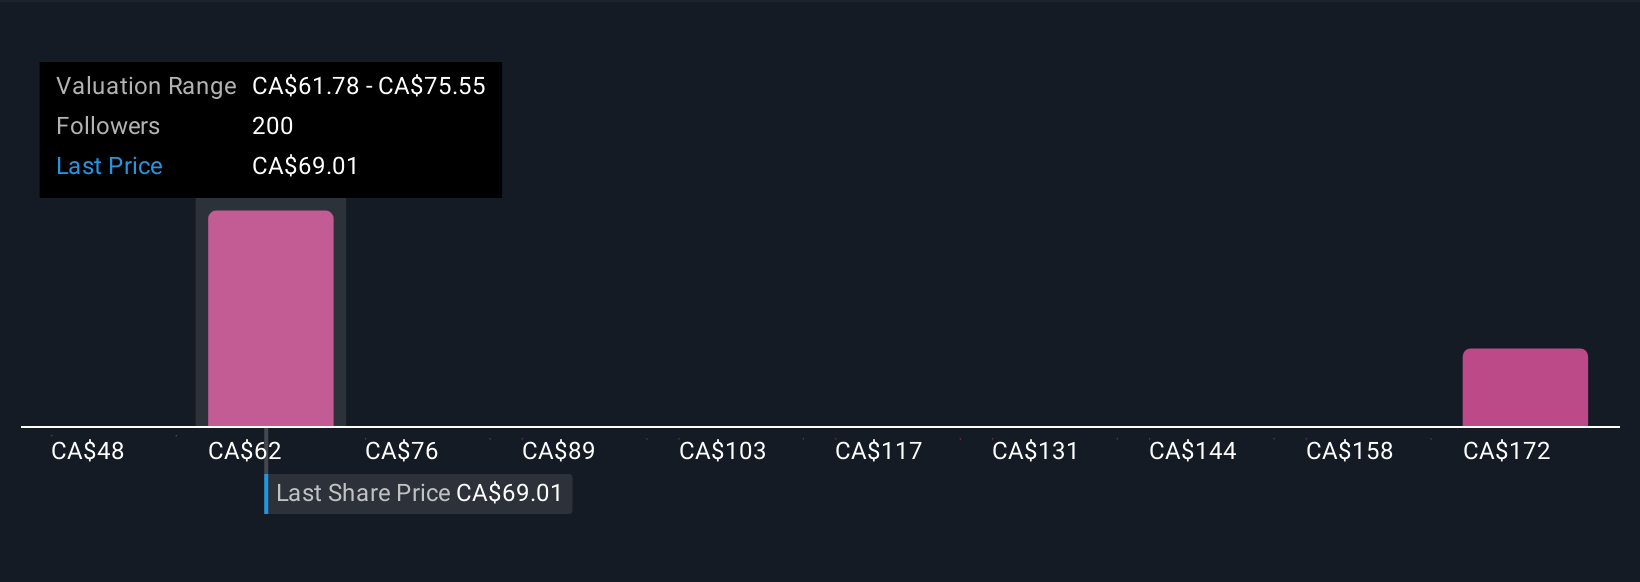
For example, some investors are optimistic, assuming Enbridge’s ongoing project pipeline, stable contracts, and leadership in renewables will drive profits and have set a Fair Value above CA$77. In contrast, others are more cautious, factoring in regulatory risk and long-term energy transition pressures, leading them to values as low as CA$60. Narratives let you visualize and act on your own investment story, so you are never just following the crowd.
Do you think there's more to the story for Enbridge? Create your own Narrative to let the Community know!
This article by Simply Wall St is general in nature. We provide commentary based on historical data and analyst forecasts only using an unbiased methodology and our articles are not intended to be financial advice. It does not constitute a recommendation to buy or sell any stock, and does not take account of your objectives, or your financial situation. We aim to bring you long-term focused analysis driven by fundamental data. Note that our analysis may not factor in the latest price-sensitive company announcements or qualitative material. Simply Wall St has no position in any stocks mentioned.
Valuation is complex, but we're here to simplify it.
Discover if Enbridge might be undervalued or overvalued with our detailed analysis, featuring fair value estimates, potential risks, dividends, insider trades, and its financial condition.
Access Free AnalysisHave feedback on this article? Concerned about the content? Get in touch with us directly. Alternatively, email editorial-team@simplywallst.com
About TSX:ENB
Proven track record second-rate dividend payer.
Similar Companies
Market Insights

Advertisement
Community Narratives
A formidable player in AI and enterprise computing.
Fair Value US$210.00|12.2% overvalued
CO
Community Contributor
IREN's Bold Moves in Sustainable Bitcoin Mining & AI Data Centers
Fair Value US$72.52|17.1% undervalued
BL
Community Contributor
Cooling the Champions: The Aussie Tech Behind F1's Victories
Fair Value AU$12.40|38.7% undervalued
TR
Community Contributor