
Advertisement
- Canada
- /
- Energy Services
- /
- TSX:EFX
There Are Reasons To Feel Uneasy About Enerflex's (TSE:EFX) Returns On Capital
If we want to find a stock that could multiply over the long term, what are the underlying trends we should look for? Ideally, a business will show two trends; firstly a growing return on capital employed (ROCE) and secondly, an increasing amount of capital employed. This shows us that it's a compounding machine, able to continually reinvest its earnings back into the business and generate higher returns. In light of that, when we looked at Enerflex (TSE:EFX) and its ROCE trend, we weren't exactly thrilled.
What Is Return On Capital Employed (ROCE)?
For those that aren't sure what ROCE is, it measures the amount of pre-tax profits a company can generate from the capital employed in its business. To calculate this metric for Enerflex, this is the formula:
Return on Capital Employed = Earnings Before Interest and Tax (EBIT) ÷ (Total Assets - Current Liabilities)
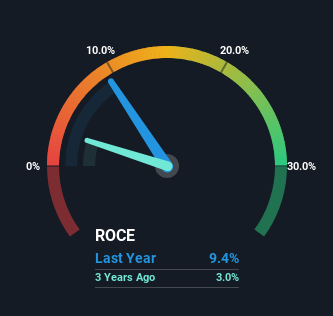
0.094 = US$177m ÷ (US$2.8b - US$911m) (Based on the trailing twelve months to December 2024).
So, Enerflex has an ROCE of 9.4%. In absolute terms, that's a low return and it also under-performs the Energy Services industry average of 14%.
View our latest analysis for Enerflex
In the above chart we have measured Enerflex's prior ROCE against its prior performance, but the future is arguably more important. If you'd like, you can check out the forecasts from the analysts covering Enerflex for free.
What Can We Tell From Enerflex's ROCE Trend?
When we looked at the ROCE trend at Enerflex, we didn't gain much confidence. Around five years ago the returns on capital were 13%, but since then they've fallen to 9.4%. However it looks like Enerflex might be reinvesting for long term growth because while capital employed has increased, the company's sales haven't changed much in the last 12 months. It may take some time before the company starts to see any change in earnings from these investments.
While on the subject, we noticed that the ratio of current liabilities to total assets has risen to 33%, which has impacted the ROCE. If current liabilities hadn't increased as much as they did, the ROCE could actually be even lower. Keep an eye on this ratio, because the business could encounter some new risks if this metric gets too high.
The Bottom Line
In summary, Enerflex is reinvesting funds back into the business for growth but unfortunately it looks like sales haven't increased much just yet. Investors must think there's better things to come because the stock has knocked it out of the park, delivering a 135% gain to shareholders who have held over the last five years. But if the trajectory of these underlying trends continue, we think the likelihood of it being a multi-bagger from here isn't high.
Enerflex does come with some risks though, we found 2 warning signs in our investment analysis, and 1 of those is concerning...
While Enerflex may not currently earn the highest returns, we've compiled a list of companies that currently earn more than 25% return on equity. Check out this free list here.
Valuation is complex, but we're here to simplify it.
Discover if Enerflex might be undervalued or overvalued with our detailed analysis, featuring fair value estimates, potential risks, dividends, insider trades, and its financial condition.
Access Free AnalysisHave feedback on this article? Concerned about the content? Get in touch with us directly. Alternatively, email editorial-team (at) simplywallst.com.
This article by Simply Wall St is general in nature. We provide commentary based on historical data and analyst forecasts only using an unbiased methodology and our articles are not intended to be financial advice. It does not constitute a recommendation to buy or sell any stock, and does not take account of your objectives, or your financial situation. We aim to bring you long-term focused analysis driven by fundamental data. Note that our analysis may not factor in the latest price-sensitive company announcements or qualitative material. Simply Wall St has no position in any stocks mentioned.
About TSX:EFX
Enerflex
Offers energy infrastructure and energy transition solutions in North America, Latin America, and the Eastern Hemisphere.
Very undervalued with adequate balance sheet.
Similar Companies
Market Insights

Advertisement
Weekly Picks
RO


RockeTeller on Santacruz Silver Mining ·
Crazy Undervalued 42 Baggers Silver Play (Active & Running Mine)
Fair Value:CA$8696.7% undervalued
11 followersusers have followed this narrative
5 commentsusers have commented on this narrative
1 likeusers have liked this narrative
RO


Robbo on Fiducian Group ·
Fiducian: Compliance Clouds or Value Opportunity?
Fair Value:AU$126.1% undervalued
1 followerusers have followed this narrative
0 commentsusers have commented on this narrative
0 likesusers have liked this narrative
WO

woodworthfund on Willamette Valley Vineyards ·
Willamette Valley Vineyards (WVVI): Not-So-Great Value
Fair Value:US$242.5% overvalued
2 followersusers have followed this narrative
0 commentsusers have commented on this narrative
1 likeusers have liked this narrative
Recently Updated Narratives
YE
Yellow_fever on China Starch Holdings ·
China Starch Holdings eyes a revenue growth of 4.66% with a 5-year strategic plan
Fair Value:HK$0.562.8% undervalued
1 followerusers have followed this narrative
0 commentsusers have commented on this narrative
0 likesusers have liked this narrative
CO

composite32 on Power Solutions International ·
PSIX The timing of insider sales is a serious question mark
Fair Value:US$37.3845.7% overvalued
1 followerusers have followed this narrative
0 commentsusers have commented on this narrative
0 likesusers have liked this narrative
TA


Talos on Marvell Technology ·
The Great Strategy Swap – Selling "Old Auto" to Buy "Future Light"
Fair Value:US$155.3740.2% undervalued
1 followerusers have followed this narrative
0 commentsusers have commented on this narrative
0 likesusers have liked this narrative
Popular Narratives
TH


TheWallstreetKing on MicroVision ·
MicroVision will explode future revenue by 380.37% with a vision towards success
Fair Value:US$6098.6% undervalued
112 followersusers have followed this narrative
11 commentsusers have commented on this narrative
22 likesusers have liked this narrative
AN


AnalystConsensusTarget on NVIDIA ·
NVDA: Expanding AI Demand Will Drive Major Data Center Investments Through 2026
Fair Value:US$250.3927.6% undervalued
947 followersusers have followed this narrative
6 commentsusers have commented on this narrative
24 likesusers have liked this narrative
OS


oscargarcia on Alphabet ·
The company that turned a verb into a global necessity and basically runs the modern internet, digital ads, smartphones, maps, and AI.
Fair Value:US$3407.2% undervalued
148 followersusers have followed this narrative
6 commentsusers have commented on this narrative
18 likesusers have liked this narrative
