
Advertisement

Key Insights
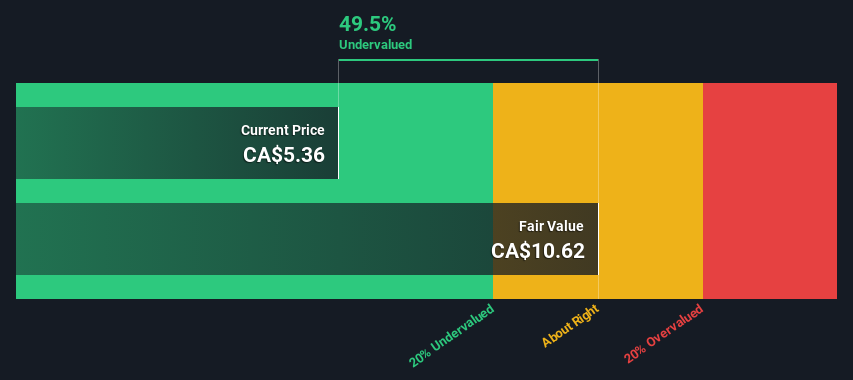
- The projected fair value for Athabasca Oil is CA$10.62 based on 2 Stage Free Cash Flow to Equity
- Athabasca Oil's CA$5.36 share price signals that it might be 50% undervalued
- Industry average discount to fair value of 31% suggests Athabasca Oil's peers are currently trading at a lower discount
In this article we are going to estimate the intrinsic value of Athabasca Oil Corporation (TSE:ATH) by taking the expected future cash flows and discounting them to today's value. This will be done using the Discounted Cash Flow (DCF) model. It may sound complicated, but actually it is quite simple!
Remember though, that there are many ways to estimate a company's value, and a DCF is just one method. For those who are keen learners of equity analysis, the Simply Wall St analysis model here may be something of interest to you.
Check out our latest analysis for Athabasca Oil
Is Athabasca Oil Fairly Valued?
We're using the 2-stage growth model, which simply means we take in account two stages of company's growth. In the initial period the company may have a higher growth rate and the second stage is usually assumed to have a stable growth rate. To begin with, we have to get estimates of the next ten years of cash flows. Where possible we use analyst estimates, but when these aren't available we extrapolate the previous free cash flow (FCF) from the last estimate or reported value. We assume companies with shrinking free cash flow will slow their rate of shrinkage, and that companies with growing free cash flow will see their growth rate slow, over this period. We do this to reflect that growth tends to slow more in the early years than it does in later years.
A DCF is all about the idea that a dollar in the future is less valuable than a dollar today, and so the sum of these future cash flows is then discounted to today's value:
10-year free cash flow (FCF) forecast
| 2025 | 2026 | 2027 | 2028 | 2029 | 2030 | 2031 | 2032 | 2033 | 2034 | |
| Levered FCF (CA$, Millions) | CA$382.7m | CA$529.0m | CA$434.0m | CA$381.5m | CA$351.6m | CA$334.5m | CA$325.2m | CA$320.9m | CA$320.0m | CA$321.3m |
| Growth Rate Estimate Source | Analyst x3 | Analyst x1 | Analyst x1 | Est @ -12.09% | Est @ -7.84% | Est @ -4.86% | Est @ -2.78% | Est @ -1.32% | Est @ -0.30% | Est @ 0.41% |
| Present Value (CA$, Millions) Discounted @ 7.2% | CA$357 | CA$460 | CA$352 | CA$289 | CA$248 | CA$220 | CA$200 | CA$184 | CA$171 | CA$160 |
("Est" = FCF growth rate estimated by Simply Wall St)
Present Value of 10-year Cash Flow (PVCF) = CA$2.6b
The second stage is also known as Terminal Value, this is the business's cash flow after the first stage. The Gordon Growth formula is used to calculate Terminal Value at a future annual growth rate equal to the 5-year average of the 10-year government bond yield of 2.1%. We discount the terminal cash flows to today's value at a cost of equity of 7.2%.
Terminal Value (TV)= FCF2034 × (1 + g) ÷ (r – g) = CA$321m× (1 + 2.1%) ÷ (7.2%– 2.1%) = CA$6.4b
Present Value of Terminal Value (PVTV)= TV / (1 + r)10= CA$6.4b÷ ( 1 + 7.2%)10= CA$3.2b
The total value is the sum of cash flows for the next ten years plus the discounted terminal value, which results in the Total Equity Value, which in this case is CA$5.8b. In the final step we divide the equity value by the number of shares outstanding. Relative to the current share price of CA$5.4, the company appears quite undervalued at a 50% discount to where the stock price trades currently. Valuations are imprecise instruments though, rather like a telescope - move a few degrees and end up in a different galaxy. Do keep this in mind.
Important Assumptions
Now the most important inputs to a discounted cash flow are the discount rate, and of course, the actual cash flows. Part of investing is coming up with your own evaluation of a company's future performance, so try the calculation yourself and check your own assumptions. The DCF also does not consider the possible cyclicality of an industry, or a company's future capital requirements, so it does not give a full picture of a company's potential performance. Given that we are looking at Athabasca Oil as potential shareholders, the cost of equity is used as the discount rate, rather than the cost of capital (or weighted average cost of capital, WACC) which accounts for debt. In this calculation we've used 7.2%, which is based on a levered beta of 1.116. Beta is a measure of a stock's volatility, compared to the market as a whole. We get our beta from the industry average beta of globally comparable companies, with an imposed limit between 0.8 and 2.0, which is a reasonable range for a stable business.
SWOT Analysis for Athabasca Oil
Strength
- Debt is not viewed as a risk.
Weakness
- Earnings declined over the past year.
Opportunity
- Annual earnings are forecast to grow faster than the Canadian market.
- Trading below our estimate of fair value by more than 20%.
Threat
- No apparent threats visible for ATH.
Looking Ahead:
Although the valuation of a company is important, it shouldn't be the only metric you look at when researching a company. DCF models are not the be-all and end-all of investment valuation. Instead the best use for a DCF model is to test certain assumptions and theories to see if they would lead to the company being undervalued or overvalued. For example, changes in the company's cost of equity or the risk free rate can significantly impact the valuation. What is the reason for the share price sitting below the intrinsic value? For Athabasca Oil, we've compiled three fundamental factors you should explore:
- Risks: For example, we've discovered 3 warning signs for Athabasca Oil that you should be aware of before investing here.
- Management:Have insiders been ramping up their shares to take advantage of the market's sentiment for ATH's future outlook? Check out our management and board analysis with insights on CEO compensation and governance factors.
- Other High Quality Alternatives: Do you like a good all-rounder? Explore our interactive list of high quality stocks to get an idea of what else is out there you may be missing!
PS. The Simply Wall St app conducts a discounted cash flow valuation for every stock on the TSX every day. If you want to find the calculation for other stocks just search here.
New: Manage All Your Stock Portfolios in One Place
We've created the ultimate portfolio companion for stock investors, and it's free.
• Connect an unlimited number of Portfolios and see your total in one currency
• Be alerted to new Warning Signs or Risks via email or mobile
• Track the Fair Value of your stocks
Have feedback on this article? Concerned about the content? Get in touch with us directly. Alternatively, email editorial-team (at) simplywallst.com.
This article by Simply Wall St is general in nature. We provide commentary based on historical data and analyst forecasts only using an unbiased methodology and our articles are not intended to be financial advice. It does not constitute a recommendation to buy or sell any stock, and does not take account of your objectives, or your financial situation. We aim to bring you long-term focused analysis driven by fundamental data. Note that our analysis may not factor in the latest price-sensitive company announcements or qualitative material. Simply Wall St has no position in any stocks mentioned.
Have feedback on this article? Concerned about the content? Get in touch with us directly. Alternatively, email editorial-team@simplywallst.com
About TSX:ATH
Athabasca Oil
Engages in the exploration, development, and production of thermal and light oil resource plays in the Western Canadian Sedimentary Basin in Alberta, Canada.
Very undervalued with flawless balance sheet.
Similar Companies
Market Insights

Advertisement
Community Narratives
SSAB in pole position when it comes to the combination of steel tariffs and the EU's investment drive
Fair Value SEK 86.87|35.6% undervalued
PI
Community Contributor
The Future of Lennar and Homebuilding Faces Short Term Challenges with Potential for Long Term Growth
Fair Value US$162.49|35.2% undervalued
ZE
Community Contributor
Saudi Aramco (SASE:2222): Not The Sexiest High Dividend Yield Stock, But One With Interesting 'Convertible-Like' Qualities
Fair Value ر.س37.02|30.0% undervalued
EV
Community Contributor