Advertisement
- Canada
- /
- Capital Markets
- /
- TSX:X
What Do Recent Gains Mean for TMX Group Stock in 2025?

Simply Wall St
Reviewed by Bailey Pemberton
Trying to figure out what to do with TMX Group stock? You are not alone. Whether you have watched it climb over the past few years or are just now hoping to catch a good entry point, TMX’s recent moves beg a closer look. Despite a slight dip over the past seven days at -3.0% and a -4.1% pullback in the last month, it is hard to ignore the impressive strength shown in the longer term, up 15.7% year-to-date and posting a remarkable 22.0% gain over the past year. Stretch that timeline further, and you will see the stock has nearly doubled over five years and more than doubled over three years, with gains of 109.9% and 116.8% respectively.
So what explains this momentum, and is there more to come? The evolving landscape for capital markets and trading infrastructure continues to work in TMX’s favor, positioning the company as a central player in Canada’s financial world. These price moves suggest the market is optimistic about TMX’s future, but a step back reveals a different story when it comes to valuation. Out of six key undervaluation checks, TMX meets only one, giving it a value score of 1. With numbers like these, the valuation story gets much more interesting.
That is where things get interesting for investors who want to see beyond the surface. Next, let us break down the main valuation approaches, and stick around because we will wrap up with an even deeper perspective that often gets overlooked.
TMX Group scores just 1/6 on our valuation checks. See what other red flags we found in the full valuation breakdown.
Approach 1: TMX Group Excess Returns Analysis
The Excess Returns model takes a straightforward approach, looking at how much value a company generates above its required cost of equity. In other words, it focuses on TMX Group’s return on invested capital and the premium it creates over what shareholders demand for their risk.
For TMX Group, the model uses a Book Value of CA$16.68 per share and projects a Stable Earnings Per Share (EPS) of CA$2.18, based on consensus Return on Equity (ROE) estimates from four analysts. The Cost of Equity is calculated at CA$1.35 per share, resulting in an Excess Return, which is what is left after meeting equity costs, of CA$0.84 per share. The company’s average ROE stands at 12.14%, with a modestly growing Stable Book Value of CA$17.98 per share, according to weighted projections from two analysts.
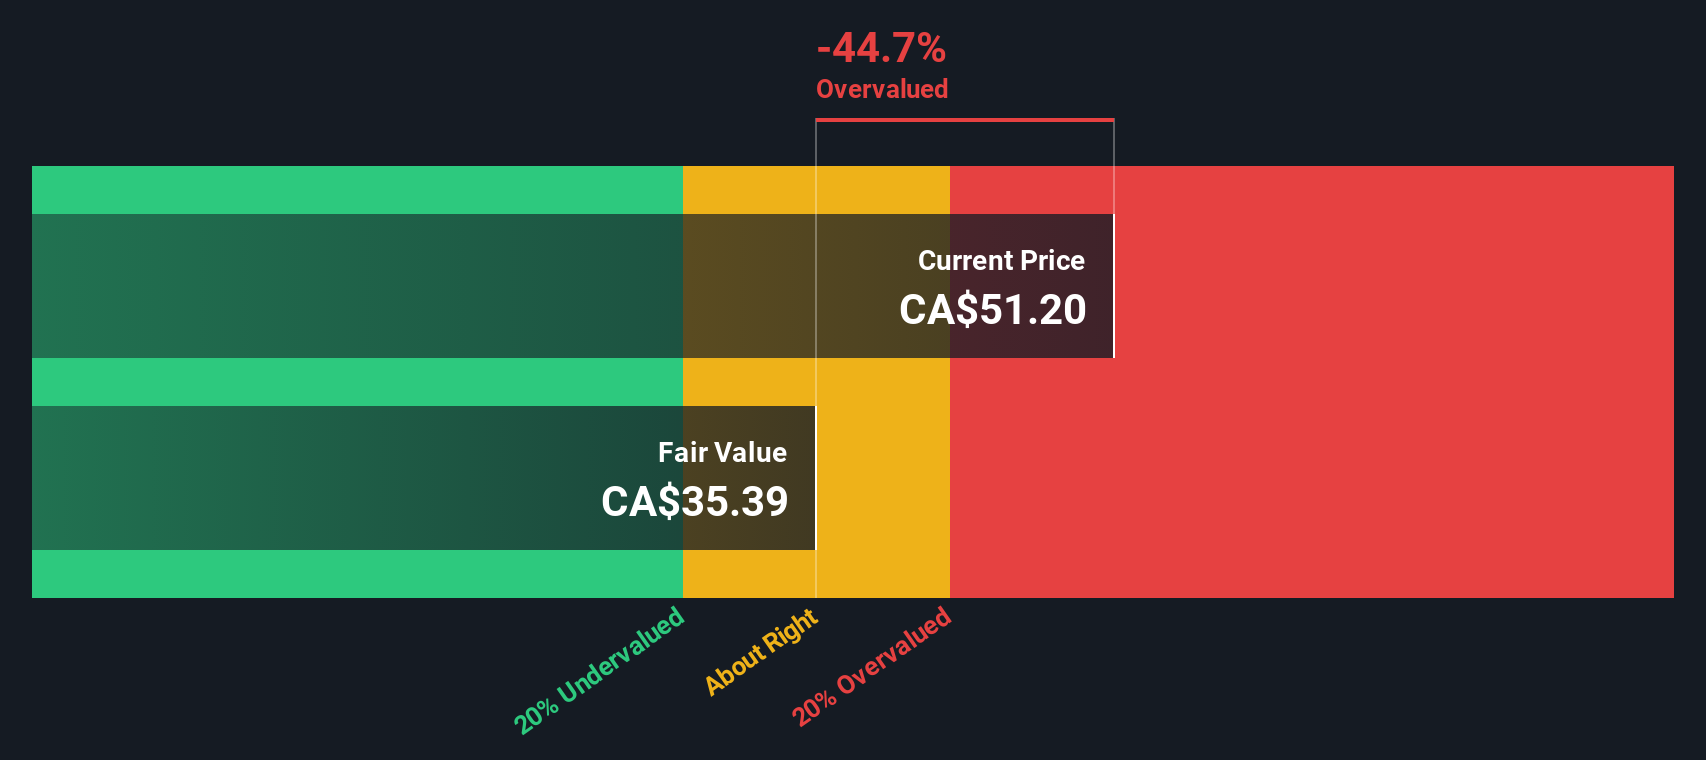
After factoring in these variables, the model’s estimated intrinsic fair value per share comes to CA$35.11. This is 46.6% lower than TMX Group’s current share price, suggesting the stock is well above what this valuation approach considers justified.
Result: OVERVALUED
Our Excess Returns analysis suggests TMX Group may be overvalued by 46.6%. Find undervalued stocks or create your own screener to find better value opportunities.
Approach 2: TMX Group Price vs Earnings
For companies that are solidly profitable, the Price-to-Earnings (PE) ratio is one of the most widely used and intuitive ways to assess valuation. It essentially shows how much investors are willing to pay for each dollar of earnings, making it a go-to metric for comparing similar businesses, especially when profits are stable and recurring.
Growth expectations and risk play a huge role in deciding what a "normal" or "fair" PE ratio should look like. Rapidly growing firms or those with less perceived risk usually see higher PE ratios, while slower-growing or riskier companies tend to command lower multiples.
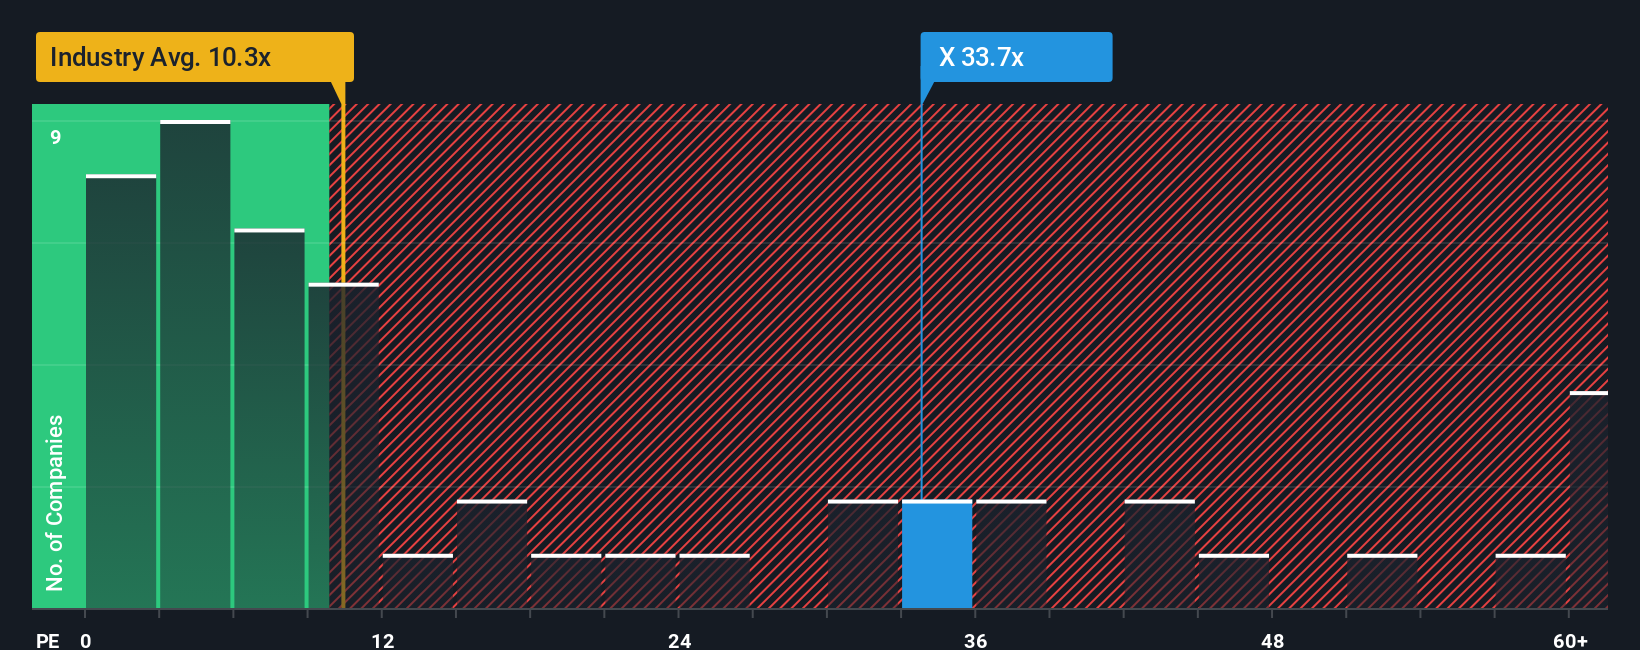
Right now, TMX Group is trading at a PE ratio of 33.94x. This looks much higher than the Capital Markets industry average of just 10.33x and also well above its closest peers, which average 26.42x. While these benchmarks are useful starting points, they do not tell the whole story because companies differ in size, growth outlook, profit margins, and risk profiles.
This is where Simply Wall St’s “Fair Ratio” comes in, which for TMX Group is calculated at 24.14x. Unlike the industry or peer benchmark, the Fair Ratio factors in TMX’s unique growth prospects, risk, margins, and market cap, providing a more complete view of what investors should reasonably pay. Comparing its actual PE ratio of 33.94x to the Fair Ratio of 24.14x, TMX Group appears to be trading at a clear premium.
Result: OVERVALUED
PE ratios tell one story, but what if the real opportunity lies elsewhere? Discover companies where insiders are betting big on explosive growth.
Upgrade Your Decision Making: Choose your TMX Group Narrative
Earlier we mentioned there is an even better way to understand valuation. Let us introduce you to Narratives. A Narrative is simply your perspective or “story” about TMX Group, backed up by your own financial forecasts, assumptions about future revenue, earnings, and margins, and the fair value you believe is justified. This approach connects what you understand about the company’s business, catalysts, and risks directly to how you value its shares, making the process both personal and analytical.
On Simply Wall St’s Community page, Narratives are an easy, powerful tool used by millions of investors, letting you visually model your argument and compare it with others in real time. Each Narrative explicitly links the company’s story, financial forecast, and fair value, then shows how your view stacks up against TMX Group’s current share price. This allows you to decide when to buy or sell and see instantly if your case for the stock still holds up.
Narratives are constantly updated when big news, earnings, or fresh data comes in, keeping your insight current and dynamic. For example, some investors’ Narratives for TMX Group set an optimistic fair value as high as CA$61.79, based on robust global growth and digital expansion. Others are more cautious, with estimates as low as CA$35.11, reflecting traditional valuation models. The story you believe shapes your decisions, and with Narratives, you can see exactly how.
Do you think there's more to the story for TMX Group? Create your own Narrative to let the Community know!

This article by Simply Wall St is general in nature. We provide commentary based on historical data and analyst forecasts only using an unbiased methodology and our articles are not intended to be financial advice. It does not constitute a recommendation to buy or sell any stock, and does not take account of your objectives, or your financial situation. We aim to bring you long-term focused analysis driven by fundamental data. Note that our analysis may not factor in the latest price-sensitive company announcements or qualitative material. Simply Wall St has no position in any stocks mentioned.
Valuation is complex, but we're here to simplify it.
Discover if TMX Group might be undervalued or overvalued with our detailed analysis, featuring fair value estimates, potential risks, dividends, insider trades, and its financial condition.
Access Free AnalysisHave feedback on this article? Concerned about the content? Get in touch with us directly. Alternatively, email editorial-team@simplywallst.com
About TSX:X
TMX Group
Operates exchanges, markets, and clearinghouses primarily for capital markets in Canada, the United States, the United Kingdom, Germany, and internationally.
Excellent balance sheet average dividend payer.
Market Insights

Advertisement
Community Narratives
A formidable player in AI and enterprise computing.
Fair Value US$210.00|12.2% overvalued
CO
Community Contributor
IREN's Bold Moves in Sustainable Bitcoin Mining & AI Data Centers
Fair Value US$72.52|17.1% undervalued
BL
Community Contributor
Cooling the Champions: The Aussie Tech Behind F1's Victories
Fair Value AU$12.40|38.1% undervalued
TR
Community Contributor