Advertisement
- Canada
- /
- Capital Markets
- /
- TSX:OLY
Olympia Financial Group (TSX:OLY): Assessing Valuation After Latest Dividend Confirmation

Simply Wall St
Reviewed by Kshitija Bhandaru
Olympia Financial Group (TSX:OLY) just confirmed its monthly dividend, declaring a CAD 0.60 per share payout scheduled for October 31, 2025. Investors tracking reliable income streams will want to mark October 22 as both the ex-dividend date and the record date.
See our latest analysis for Olympia Financial Group.
Olympia Financial Group's latest dividend announcement comes as the stock takes a breather. Its share price has pulled back 13.5% over the past month, yet the company has quietly delivered an impressive 19% one-year total shareholder return and a staggering 299% over five years. Momentum has cooled lately, but long-term investors are still well ahead, hinting at a story that is more than just recent price moves.
If steady returns and income reliability appeal to you, it could be the perfect moment to see what else is on the move and discover fast growing stocks with high insider ownership
With shares still trading well below analyst price targets and long-term returns outpacing recent results, investors may wonder whether Olympia Financial Group is now undervalued or if the market is already pricing in all the future growth potential.
Price-to-Earnings of 11.7x: Is it justified?
Olympia Financial Group trades at a price-to-earnings (P/E) ratio of 11.7x, which puts its value in the spotlight. At last close, shares stood at CA$112.55, offering investors a snapshot of how much the market is willing to pay for each dollar of current earnings.
The price-to-earnings ratio compares a company's stock price to its earnings per share and is a key metric for assessing how a stock is priced relative to its profitability. In the financial sector, P/E ratios are a quick way to gauge whether investors believe earnings are sustainable or expected to grow.
Olympia's P/E sits slightly above the Canadian Capital Markets industry average of 10.3x, suggesting a modest premium. However, when compared to its peer average P/E of 18.7x, Olympia appears attractively valued. Relative to its estimated fair P/E of 12.7x, the stock could see room for upward adjustment if conditions improve.
Explore the SWS fair ratio for Olympia Financial Group
Result: Price-to-Earnings of 11.7x (UNDERVALUED)
However, slowing revenue and net income growth could signal challenges ahead. If these trends persist, they could potentially undermine Olympia's strong returns.
Find out about the key risks to this Olympia Financial Group narrative.
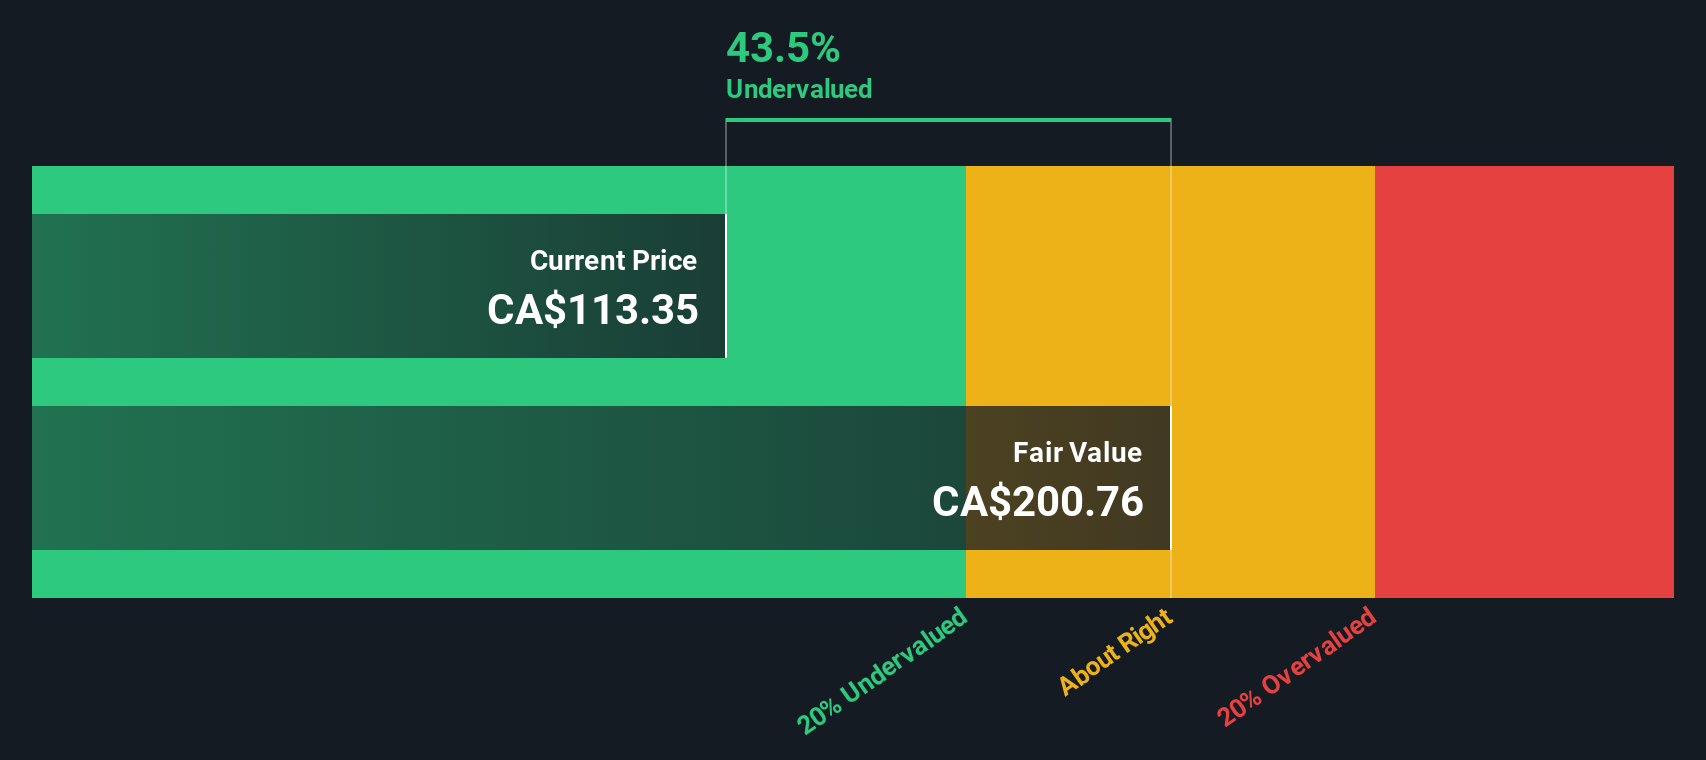
Another View: Our DCF Model Tells a Different Story
While multiples paint Olympia as attractively priced, our SWS DCF model shows an even wider gap. Shares currently trade 44% below their estimated fair value, calculated at CA$201.69. This suggests the market may be underestimating Olympia’s longer-term earning power, or is there a reason for skepticism?
Look into how the SWS DCF model arrives at its fair value.
Simply Wall St performs a discounted cash flow (DCF) on every stock in the world every day (check out Olympia Financial Group for example). We show the entire calculation in full. You can track the result in your watchlist or portfolio and be alerted when this changes, or use our stock screener to discover undervalued stocks based on their cash flows. If you save a screener we even alert you when new companies match - so you never miss a potential opportunity.
Build Your Own Olympia Financial Group Narrative
If you want to draw your own conclusions or prefer hands-on research, you can build a personalized view in just a few minutes. So why not Do it your way
A great starting point for your Olympia Financial Group research is our analysis highlighting 1 key reward and 2 important warning signs that could impact your investment decision.
Looking for more investment ideas?
Stay ahead of the market by looking beyond a single stock. Unique opportunities are waiting to be uncovered with the right tools.
- Boost your portfolio's income by targeting reliable yield with these 19 dividend stocks with yields > 3%, which consistently offer above-average returns for income-focused investors.
- Capture the growth potential in artificial intelligence by tapping into these 25 AI penny stocks, which are poised to shape sectors like healthcare, fintech, and advanced data analytics.
- Uncover underappreciated gems by locking in value with these 891 undervalued stocks based on cash flows, set to outperform based on robust fundamentals and strong future cash flows.
This article by Simply Wall St is general in nature. We provide commentary based on historical data and analyst forecasts only using an unbiased methodology and our articles are not intended to be financial advice. It does not constitute a recommendation to buy or sell any stock, and does not take account of your objectives, or your financial situation. We aim to bring you long-term focused analysis driven by fundamental data. Note that our analysis may not factor in the latest price-sensitive company announcements or qualitative material. Simply Wall St has no position in any stocks mentioned.
New: AI Stock Screener & Alerts
Our new AI Stock Screener scans the market every day to uncover opportunities.
• Dividend Powerhouses (3%+ Yield)
• Undervalued Small Caps with Insider Buying
• High growth Tech and AI Companies
Or build your own from over 50 metrics.
Have feedback on this article? Concerned about the content? Get in touch with us directly. Alternatively, email editorial-team@simplywallst.com
About TSX:OLY
Olympia Financial Group
Through its subsidiary, Olympia Trust Company, operates as a non-deposit taking trust company in Canada.
Flawless balance sheet established dividend payer.
Market Insights

Advertisement
Community Narratives
A formidable player in AI and enterprise computing.
Fair Value US$210.00|12.2% overvalued
CO
Community Contributor
IREN's Bold Moves in Sustainable Bitcoin Mining & AI Data Centers
Fair Value US$72.52|17.1% undervalued
BL
Community Contributor
Cooling the Champions: The Aussie Tech Behind F1's Victories
Fair Value AU$12.40|38.7% undervalued
TR
Community Contributor