- Canada
- /
- Diversified Financial
- /
- TSX:FN
First National Financial's (TSE:FN) five-year earnings growth trails the 17% YoY shareholder returns


If you want to compound wealth in the stock market, you can do so by buying an index fund. But in our experience, buying the right stocks can give your wealth a significant boost. For example, the First National Financial Corporation (TSE:FN) share price is up 50% in the last five years, slightly above the market return. Also positive is the 12% share price rise over the last year.
Since the stock has added CA$106m to its market cap in the past week alone, let's see if underlying performance has been driving long-term returns.
Check out our latest analysis for First National Financial
To quote Buffett, 'Ships will sail around the world but the Flat Earth Society will flourish. There will continue to be wide discrepancies between price and value in the marketplace...' By comparing earnings per share (EPS) and share price changes over time, we can get a feel for how investor attitudes to a company have morphed over time.
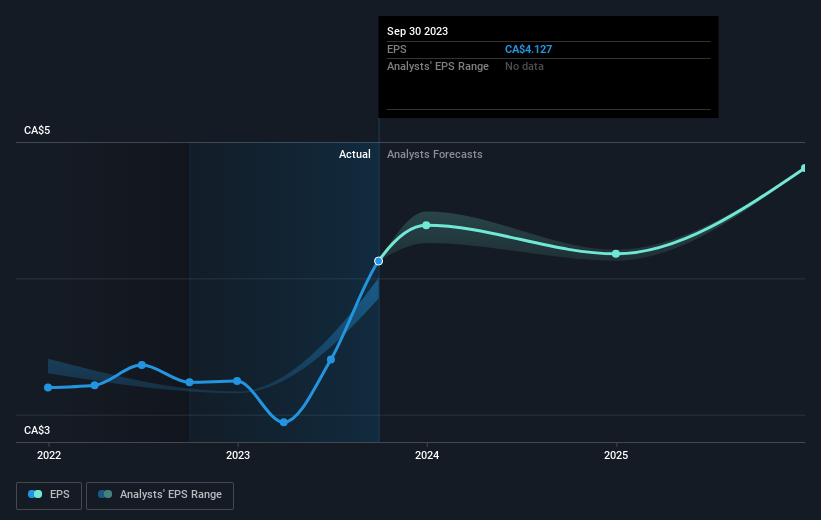
Over half a decade, First National Financial managed to grow its earnings per share at 6.9% a year. This EPS growth is reasonably close to the 8% average annual increase in the share price. Therefore one could conclude that sentiment towards the shares hasn't morphed very much. Indeed, it would appear the share price is reacting to the EPS.
You can see how EPS has changed over time in the image below (click on the chart to see the exact values).
It's probably worth noting we've seen significant insider buying in the last quarter, which we consider a positive. On the other hand, we think the revenue and earnings trends are much more meaningful measures of the business. It might be well worthwhile taking a look at our free report on First National Financial's earnings, revenue and cash flow.
What About Dividends?
When looking at investment returns, it is important to consider the difference between total shareholder return (TSR) and share price return. The TSR incorporates the value of any spin-offs or discounted capital raisings, along with any dividends, based on the assumption that the dividends are reinvested. So for companies that pay a generous dividend, the TSR is often a lot higher than the share price return. In the case of First National Financial, it has a TSR of 116% for the last 5 years. That exceeds its share price return that we previously mentioned. This is largely a result of its dividend payments!
A Different Perspective
It's good to see that First National Financial has rewarded shareholders with a total shareholder return of 22% in the last twelve months. That's including the dividend. Since the one-year TSR is better than the five-year TSR (the latter coming in at 17% per year), it would seem that the stock's performance has improved in recent times. Someone with an optimistic perspective could view the recent improvement in TSR as indicating that the business itself is getting better with time. I find it very interesting to look at share price over the long term as a proxy for business performance. But to truly gain insight, we need to consider other information, too. Case in point: We've spotted 1 warning sign for First National Financial you should be aware of.
If you like to buy stocks alongside management, then you might just love this free list of companies. (Hint: insiders have been buying them).
Please note, the market returns quoted in this article reflect the market weighted average returns of stocks that currently trade on Canadian exchanges.
New: AI Stock Screener & Alerts
Our new AI Stock Screener scans the market every day to uncover opportunities.
• Dividend Powerhouses (3%+ Yield)
• Undervalued Small Caps with Insider Buying
• High growth Tech and AI Companies
Or build your own from over 50 metrics.
Have feedback on this article? Concerned about the content? Get in touch with us directly. Alternatively, email editorial-team (at) simplywallst.com.
This article by Simply Wall St is general in nature. We provide commentary based on historical data and analyst forecasts only using an unbiased methodology and our articles are not intended to be financial advice. It does not constitute a recommendation to buy or sell any stock, and does not take account of your objectives, or your financial situation. We aim to bring you long-term focused analysis driven by fundamental data. Note that our analysis may not factor in the latest price-sensitive company announcements or qualitative material. Simply Wall St has no position in any stocks mentioned.
About TSX:FN
First National Financial
First National Financial Corporation, together with its subsidiaries, originates, underwrites, and services commercial and residential mortgages in Canada.
Undervalued established dividend payer.
Market Insights

Community Narratives
