
Advertisement
- Canada
- /
- Capital Markets
- /
- TSX:CVG
Here's Why Clairvest Group Inc.'s (TSE:CVG) CEO Compensation Is The Least Of Shareholders' Concerns
Under the guidance of CEO Ken Rotman, Clairvest Group Inc. (TSE:CVG) has performed reasonably well recently. This is something shareholders will keep in mind as they cast their votes on company resolutions such as executive remuneration in the upcoming AGM on 11 August 2021. Based on our analysis of the data below, we think CEO compensation seems reasonable for now.
Check out our latest analysis for Clairvest Group
Comparing Clairvest Group Inc.'s CEO Compensation With the industry
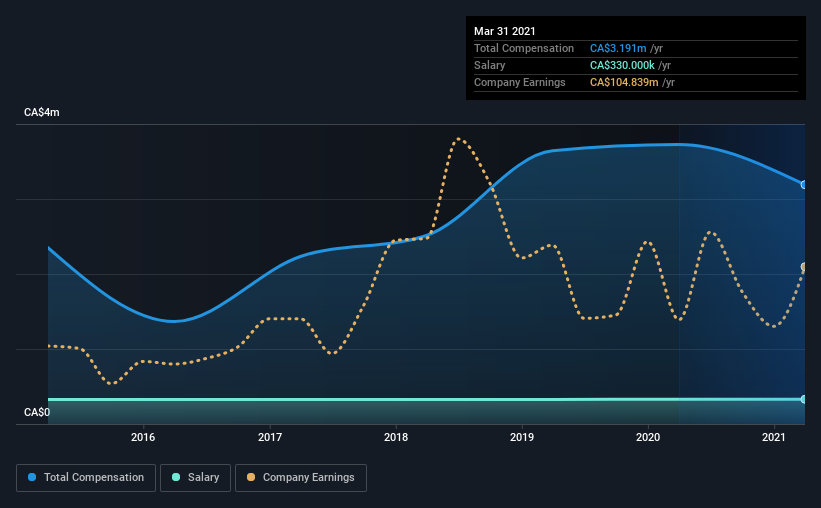
At the time of writing, our data shows that Clairvest Group Inc. has a market capitalization of CA$940m, and reported total annual CEO compensation of CA$3.2m for the year to March 2021. We note that's a decrease of 14% compared to last year. We think total compensation is more important but our data shows that the CEO salary is lower, at CA$330k.
On comparing similar companies from the same industry with market caps ranging from CA$502m to CA$2.0b, we found that the median CEO total compensation was CA$3.6m. From this we gather that Ken Rotman is paid around the median for CEOs in the industry. What's more, Ken Rotman holds CA$313m worth of shares in the company in their own name, indicating that they have a lot of skin in the game.
| Component | 2021 | 2020 | Proportion (2021) |
| Salary | CA$330k | CA$330k | 10% |
| Other | CA$2.9m | CA$3.4m | 90% |
| Total Compensation | CA$3.2m | CA$3.7m | 100% |
On an industry level, roughly 44% of total compensation represents salary and 56% is other remuneration. Clairvest Group sets aside a smaller share of compensation for salary, in comparison to the overall industry. If total compensation is slanted towards non-salary benefits, it indicates that CEO pay is linked to company performance.
Clairvest Group Inc.'s Growth
Over the last three years, Clairvest Group Inc. has shrunk its earnings per share by 5.1% per year. It achieved revenue growth of 37% over the last year.
The decrease in EPS could be a concern for some investors. On the other hand, the strong revenue growth suggests the business is growing. It's hard to reach a conclusion about business performance right now. This may be one to watch. While we don't have analyst forecasts for the company, shareholders might want to examine this detailed historical graph of earnings, revenue and cash flow.
Has Clairvest Group Inc. Been A Good Investment?
Boasting a total shareholder return of 43% over three years, Clairvest Group Inc. has done well by shareholders. This strong performance might mean some shareholders don't mind if the CEO were to be paid more than is normal for a company of its size.
In Summary...
The overall company performance has been commendable, however there are still areas for improvement. We reckon that there are some shareholders who may be hesitant to increase CEO pay further until EPS growth starts to improve, despite the robust revenue growth.
CEO compensation is a crucial aspect to keep your eyes on but investors also need to keep their eyes open for other issues related to business performance. We did our research and spotted 1 warning sign for Clairvest Group that investors should look into moving forward.
Important note: Clairvest Group is an exciting stock, but we understand investors may be looking for an unencumbered balance sheet and blockbuster returns. You might find something better in this list of interesting companies with high ROE and low debt.
If you’re looking to trade a wide range of investments, open an account with the lowest-cost* platform trusted by professionals, Interactive Brokers. Their clients from over 200 countries and territories trade stocks, options, futures, forex, bonds and funds worldwide from a single integrated account. Promoted
New: AI Stock Screener & Alerts
Our new AI Stock Screener scans the market every day to uncover opportunities.
• Dividend Powerhouses (3%+ Yield)
• Undervalued Small Caps with Insider Buying
• High growth Tech and AI Companies
Or build your own from over 50 metrics.
This article by Simply Wall St is general in nature. It does not constitute a recommendation to buy or sell any stock, and does not take account of your objectives, or your financial situation. We aim to bring you long-term focused analysis driven by fundamental data. Note that our analysis may not factor in the latest price-sensitive company announcements or qualitative material. Simply Wall St has no position in any stocks mentioned.
*Interactive Brokers Rated Lowest Cost Broker by StockBrokers.com Annual Online Review 2020
Have feedback on this article? Concerned about the content? Get in touch with us directly. Alternatively, email editorial-team (at) simplywallst.com.
About TSX:CVG
Clairvest Group
A private equity firm specializing in mid-market, growth equity investments, buyouts, industry consolidation and acquisitions.
Flawless balance sheet with proven track record and pays a dividend.
Market Insights

Advertisement
Community Narratives
The company that turned a verb into a global necessity and basically runs the modern internet, digital ads, smartphones, maps, and AI.
Fair Value US$300.00|10.8% undervalued
OS
Community Contributor
Flowers Foods Pays A Fair Price For Health
Fair Value US$16.12|22.0% undervalued
NV
Community Contributor
TMX Group will thrive with 33.3% profit margin and enduring market moat
Fair Value CA$49.90|3.8% overvalued
LI
Community Contributor