What Recent Management Shakeup Means for Gildan Activewear’s 2025 Valuation

Reviewed by Bailey Pemberton
Thinking about what to do with your Gildan Activewear shares or wondering if now is a smart time to jump in? You are not alone. With Gildan’s stock closing at $85.14 and notching impressive returns, there is plenty to talk about. Over just the past week, the stock climbed 5.9%, while the past month yielded a gain of 10.8%. Looking at the bigger picture, Gildan has posted a year-to-date return of 26.5%. If you zoom out further, returns stand at 34.0% for the past year, 128.6% for the past three years, and a remarkable 214.0% over five years.
Much of this momentum reflects optimism around broader market trends and investor confidence that Gildan is positioned to benefit from shifts in global demand for apparel. Changes in supply chains, a more resilient retail environment, and evolving consumer preferences have all supported renewed attention on the stock. There may be debates about future risks, but the direction over both the short and long term has caught the eyes of investors seeking growth.
Of course, past performance is just the start. What often matters even more is how the stock is valued right now. Gildan currently earns a value score of 5 out of 6, indicating it is undervalued in five of six key valuation checks. While standard valuation measures tell part of the story, the question remains: could there be a more insightful way to gauge whether Gildan is truly a bargain? Let’s walk through how the current numbers stack up, and then explore a different lens for understanding valuation altogether.
Approach 1: Gildan Activewear Discounted Cash Flow (DCF) Analysis
A Discounted Cash Flow (DCF) model estimates a company’s intrinsic value by projecting its future cash flows and discounting them back to their present value. For Gildan Activewear, this means forecasting how much free cash the business will generate and then accounting for the time value of money.
Currently, Gildan reports a trailing twelve-month Free Cash Flow (FCF) of $237.2 Million. Analyst projections show that by 2027, FCF could reach $869 Million. Looking further ahead via Simply Wall St’s extended assumptions, the company’s FCF is expected to continue growing, rising to over $1.3 Billion by 2035 as growth rates gradually moderate over the decade.
Using the 2 Stage Free Cash Flow to Equity DCF model, Gildan’s intrinsic value is estimated at $172.68 per share. This is more than double the recent closing price of $85.14. This indicates the stock is trading at about a 50.7% discount based on these cash flow projections. In summary, DCF analysis suggests the market is undervaluing Gildan’s long-term cash-generating potential.
Result: UNDERVALUED
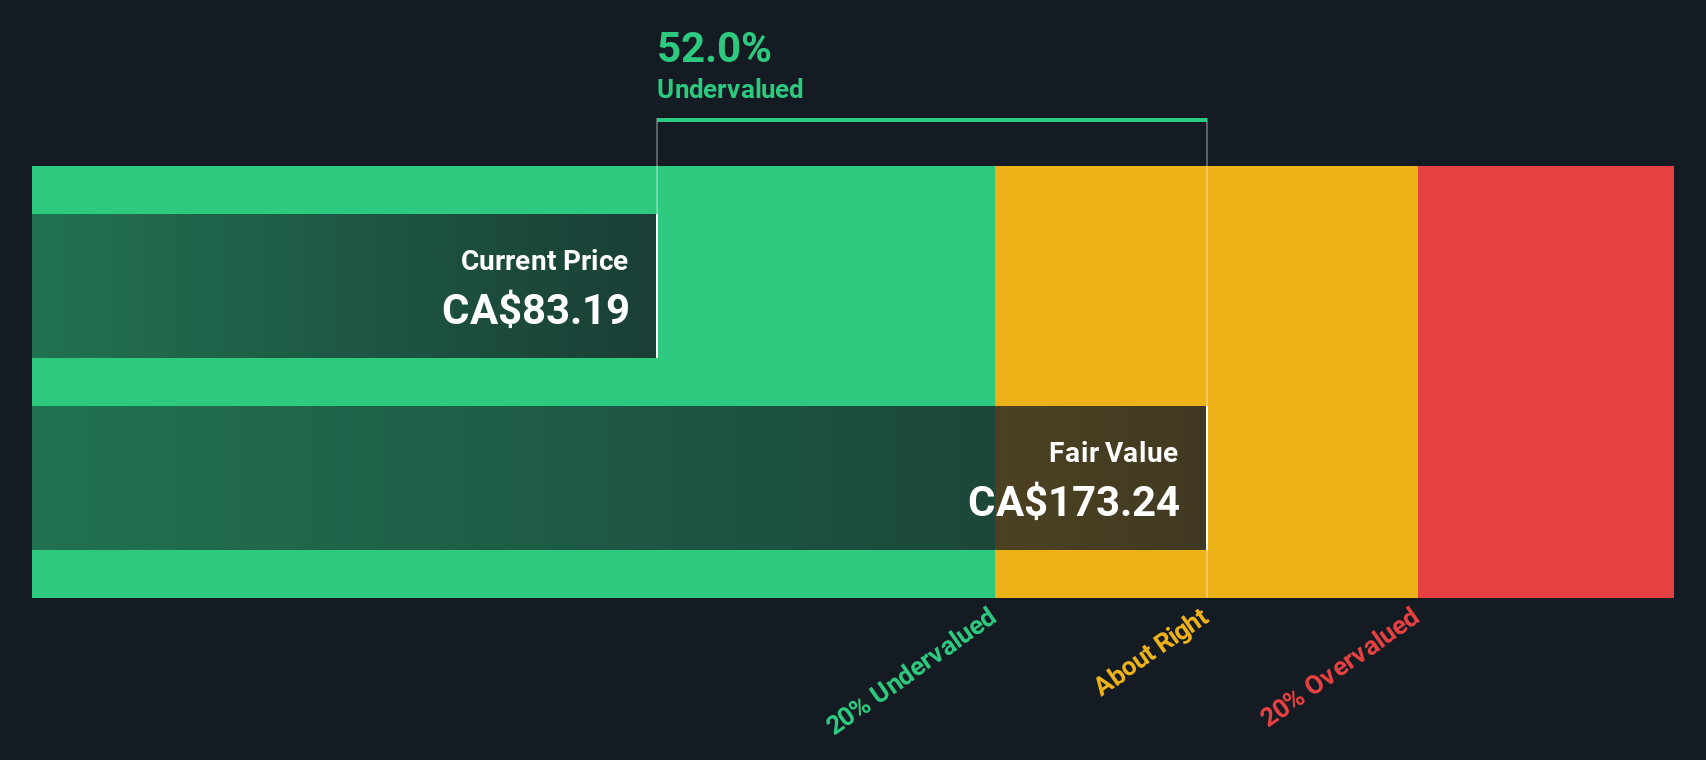
Our Discounted Cash Flow (DCF) analysis suggests Gildan Activewear is undervalued by 50.7%. Track this in your watchlist or portfolio, or discover more undervalued stocks.
Approach 2: Gildan Activewear Price vs Earnings
The price-to-earnings (PE) ratio is a widely used valuation metric for profitable companies like Gildan Activewear because it directly measures how much investors are willing to pay today for one dollar of earnings. For established companies, the PE ratio is especially useful since it reflects expectations for future growth, profitability, and risk. Generally, a higher growth outlook or lower risk profile justifies a higher “normal” PE ratio, while slower growth or elevated risk should result in a lower one.
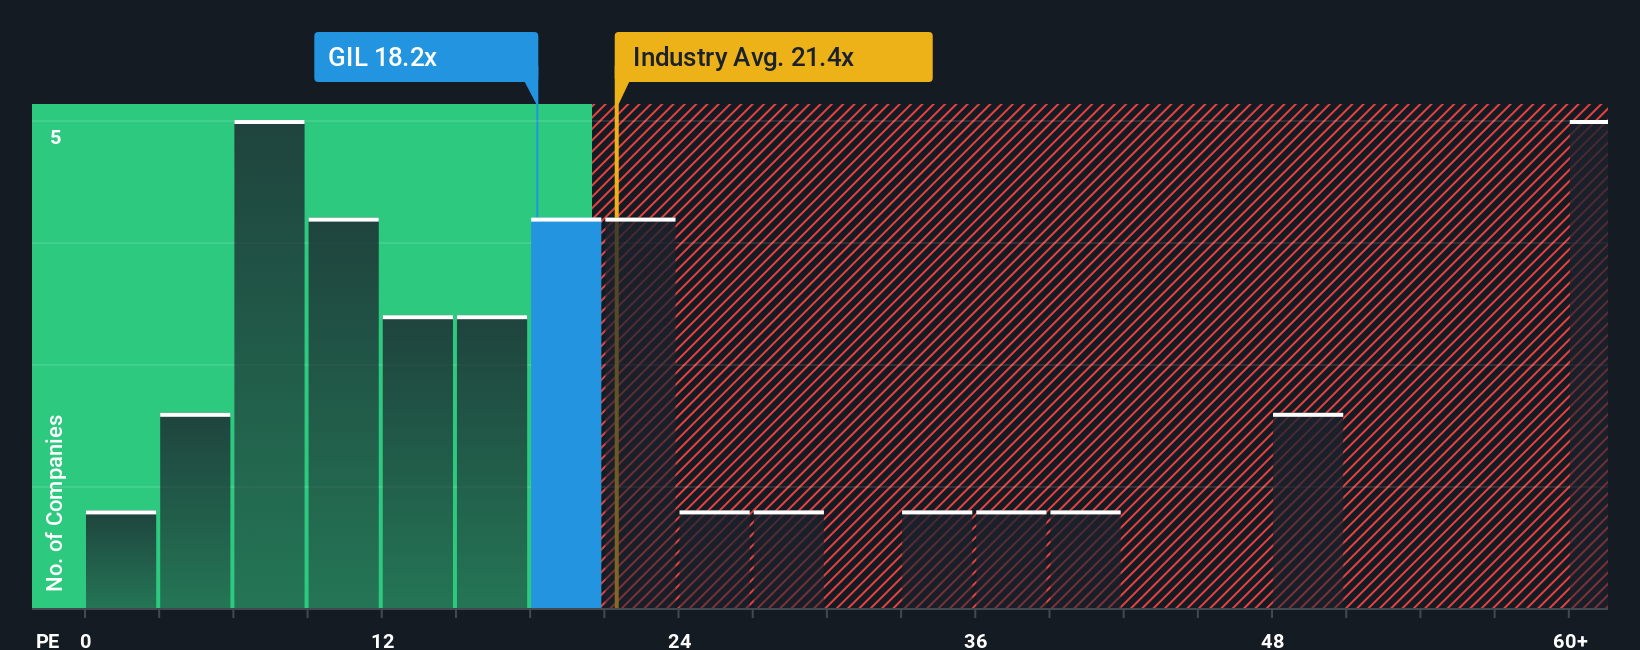
Gildan Activewear currently trades at a PE ratio of 18.7x. When compared to the Luxury industry average of 18.7x and the peer group average of 34.1x, Gildan’s valuation looks reasonable but noticeably lower than similar-sized competitors. However, benchmarks like these only tell part of the story.
This is where Simply Wall St’s “Fair Ratio” comes in. Rather than just comparing to raw industry or peer group averages, the Fair Ratio calculates what would be a justified PE given Gildan’s specific profile, factoring in its growth prospects, margins, market capitalization, and unique risks. For Gildan, the Fair Ratio stands at 29.2x, which is substantially higher than the current multiple and also above the industry and most direct competitors. This wider lens reveals that the market may not be fully valuing Gildan’s earnings potential or relative strengths.
Result: UNDERVALUED
PE ratios tell one story, but what if the real opportunity lies elsewhere? Discover companies where insiders are betting big on explosive growth.
Upgrade Your Decision Making: Choose your Gildan Activewear Narrative
Earlier we mentioned that there is an even better way to understand valuation, so let's introduce you to Narratives. A Narrative is a simple, powerful tool that lets you define your own perspective on a company, going beyond just numbers by tying together your assumptions about Gildan's future revenue, margins, and risks into a story that produces a personal estimate of fair value.
In essence, Narratives connect what you believe about Gildan—whether it is the company’s products, strengths, industry trends, or risks—to a concrete financial forecast, and then directly to an up-to-date fair value for the stock. Through Simply Wall St’s popular Community page, used by millions of investors, creating a Narrative is as approachable as answering a few guided questions about business growth and profitability.
Narratives help you quickly see whether you think Gildan's stock price is above or below what it should be by comparing your own fair value to the live market price. This gives you clarity on whether it is a buy, hold, or sell. Plus, as new news or company results are released, Narratives are dynamically updated so your forecast and fair value always reflect the latest information.
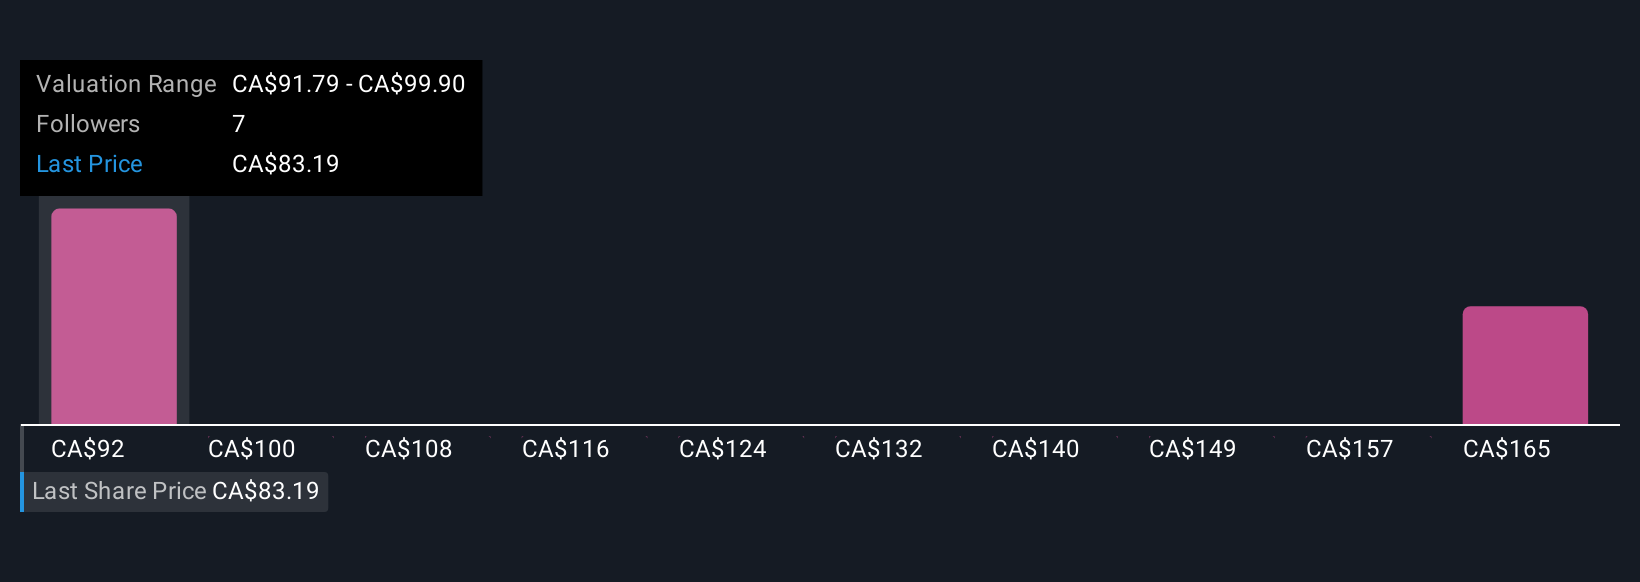
For example, some investors believe Gildan’s efficiency and brand expansion will drive significant growth and set a high fair value target of CA$128.12, while others are more cautious and set a target of just CA$80.08. Your Narrative can capture your personal outlook just as easily.
Do you think there's more to the story for Gildan Activewear? Create your own Narrative to let the Community know!
This article by Simply Wall St is general in nature. We provide commentary based on historical data and analyst forecasts only using an unbiased methodology and our articles are not intended to be financial advice. It does not constitute a recommendation to buy or sell any stock, and does not take account of your objectives, or your financial situation. We aim to bring you long-term focused analysis driven by fundamental data. Note that our analysis may not factor in the latest price-sensitive company announcements or qualitative material. Simply Wall St has no position in any stocks mentioned.
The New Payments ETF Is Live on NASDAQ:
Money is moving to real-time rails, and a newly listed ETF now gives investors direct exposure. Fast settlement. Institutional custody. Simple access.
Explore how this launch could reshape portfolios
Sponsored ContentNew: Manage All Your Stock Portfolios in One Place
We've created the ultimate portfolio companion for stock investors, and it's free.
• Connect an unlimited number of Portfolios and see your total in one currency
• Be alerted to new Warning Signs or Risks via email or mobile
• Track the Fair Value of your stocks
Have feedback on this article? Concerned about the content? Get in touch with us directly. Alternatively, email editorial-team@simplywallst.com
About TSX:GIL
Very undervalued with exceptional growth potential.
Similar Companies
Market Insights

Weekly Picks

THE KINGDOM OF BROWN GOODS: WHY MGPI IS BEING CRUSHED BY INVENTORY & PRIMED FOR RESURRECTION


Why Vertical Aerospace (NYSE: EVTL) is Worth Possibly Over 13x its Current Price


The Quiet Giant That Became AI’s Power Grid
Recently Updated Narratives

Deep Value Multi Bagger Opportunity


A case for CA$31.80 (undiluted), aka 8,616% upside from CA$0.37 (an 86 bagger!).


Unicycive Therapeutics (Nasdaq: UNCY) – Preparing for a Second Shot at Bringing a New Kidney Treatment to Market (TEST)
Popular Narratives


MicroVision will explode future revenue by 380.37% with a vision towards success


NVDA: Expanding AI Demand Will Drive Major Data Center Investments Through 2026


Crazy Undervalued 42 Baggers Silver Play (Active & Running Mine)
Trending Discussion

