Investors Still Aren't Entirely Convinced By Omni-Lite Industries Canada Inc.'s (CVE:OML) Revenues Despite 31% Price Jump

The Omni-Lite Industries Canada Inc. (CVE:OML) share price has done very well over the last month, posting an excellent gain of 31%. Looking back a bit further, it's encouraging to see the stock is up 67% in the last year.
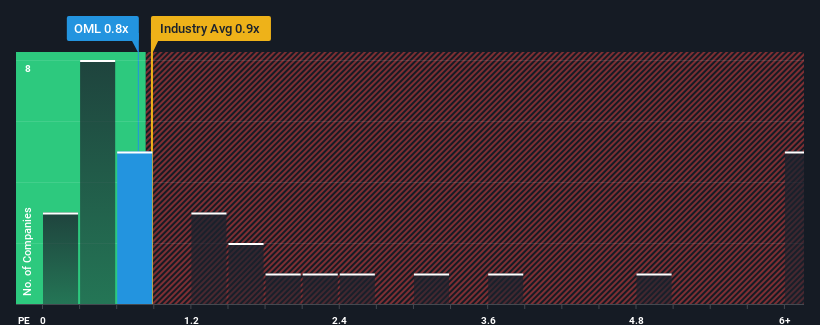
In spite of the firm bounce in price, you could still be forgiven for feeling indifferent about Omni-Lite Industries Canada's P/S ratio of 0.8x, since the median price-to-sales (or "P/S") ratio for the Machinery industry in Canada is also close to 0.9x. Although, it's not wise to simply ignore the P/S without explanation as investors may be disregarding a distinct opportunity or a costly mistake.
View our latest analysis for Omni-Lite Industries Canada

What Does Omni-Lite Industries Canada's Recent Performance Look Like?
Revenue has risen firmly for Omni-Lite Industries Canada recently, which is pleasing to see. One possibility is that the P/S is moderate because investors think this respectable revenue growth might not be enough to outperform the broader industry in the near future. If that doesn't eventuate, then existing shareholders probably aren't too pessimistic about the future direction of the share price.
Want the full picture on earnings, revenue and cash flow for the company? Then our free report on Omni-Lite Industries Canada will help you shine a light on its historical performance.How Is Omni-Lite Industries Canada's Revenue Growth Trending?
There's an inherent assumption that a company should be matching the industry for P/S ratios like Omni-Lite Industries Canada's to be considered reasonable.
If we review the last year of revenue growth, the company posted a worthy increase of 11%. This was backed up an excellent period prior to see revenue up by 86% in total over the last three years. Therefore, it's fair to say the revenue growth recently has been superb for the company.
When compared to the industry's one-year growth forecast of 11%, the most recent medium-term revenue trajectory is noticeably more alluring
With this information, we find it interesting that Omni-Lite Industries Canada is trading at a fairly similar P/S compared to the industry. It may be that most investors are not convinced the company can maintain its recent growth rates.
What Does Omni-Lite Industries Canada's P/S Mean For Investors?
Its shares have lifted substantially and now Omni-Lite Industries Canada's P/S is back within range of the industry median. While the price-to-sales ratio shouldn't be the defining factor in whether you buy a stock or not, it's quite a capable barometer of revenue expectations.
To our surprise, Omni-Lite Industries Canada revealed its three-year revenue trends aren't contributing to its P/S as much as we would have predicted, given they look better than current industry expectations. When we see strong revenue with faster-than-industry growth, we can only assume potential risks are what might be placing pressure on the P/S ratio. At least the risk of a price drop looks to be subdued if recent medium-term revenue trends continue, but investors seem to think future revenue could see some volatility.
We don't want to rain on the parade too much, but we did also find 2 warning signs for Omni-Lite Industries Canada (1 shouldn't be ignored!) that you need to be mindful of.
If companies with solid past earnings growth is up your alley, you may wish to see this free collection of other companies with strong earnings growth and low P/E ratios.
New: AI Stock Screener & Alerts
Our new AI Stock Screener scans the market every day to uncover opportunities.
• Dividend Powerhouses (3%+ Yield)
• Undervalued Small Caps with Insider Buying
• High growth Tech and AI Companies
Or build your own from over 50 metrics.
Have feedback on this article? Concerned about the content? Get in touch with us directly. Alternatively, email editorial-team (at) simplywallst.com.
This article by Simply Wall St is general in nature. We provide commentary based on historical data and analyst forecasts only using an unbiased methodology and our articles are not intended to be financial advice. It does not constitute a recommendation to buy or sell any stock, and does not take account of your objectives, or your financial situation. We aim to bring you long-term focused analysis driven by fundamental data. Note that our analysis may not factor in the latest price-sensitive company announcements or qualitative material. Simply Wall St has no position in any stocks mentioned.
About TSXV:OML
Omni-Lite Industries Canada
Manufactures metal alloy, composite components, and fastener systems in the United States and Canada.
Flawless balance sheet and good value.


