DIRTT Environmental Solutions Ltd. (TSE:DRT) Stock Catapults 26% Though Its Price And Business Still Lag The Industry

DIRTT Environmental Solutions Ltd. (TSE:DRT) shares have had a really impressive month, gaining 26% after a shaky period beforehand. Longer-term shareholders would be thankful for the recovery in the share price since it's now virtually flat for the year after the recent bounce.
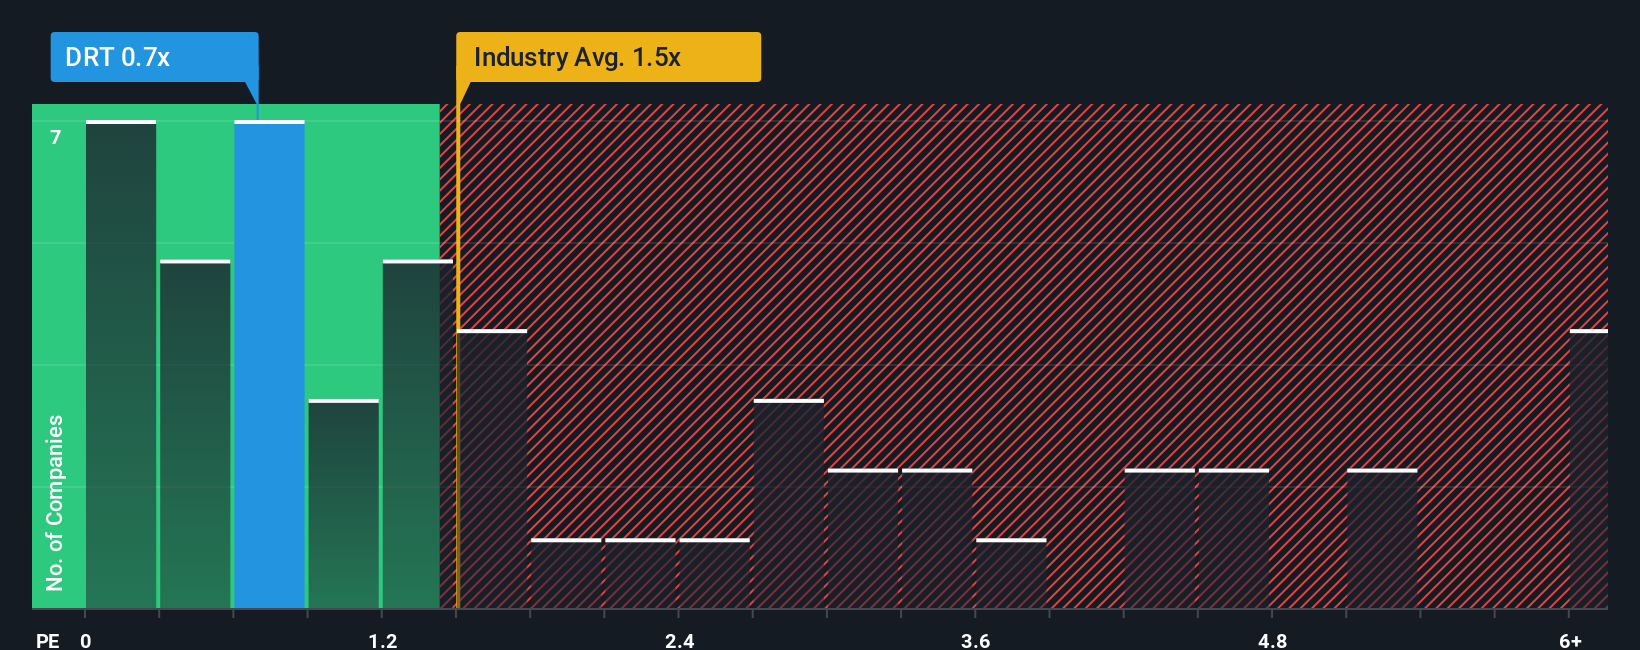
In spite of the firm bounce in price, DIRTT Environmental Solutions' price-to-sales (or "P/S") ratio of 0.7x might still make it look like a buy right now compared to the Building industry in Canada, where around half of the companies have P/S ratios above 1.5x and even P/S above 4x are quite common. Although, it's not wise to just take the P/S at face value as there may be an explanation why it's limited.
Check out our latest analysis for DIRTT Environmental Solutions
What Does DIRTT Environmental Solutions' P/S Mean For Shareholders?
While the industry has experienced revenue growth lately, DIRTT Environmental Solutions' revenue has gone into reverse gear, which is not great. The P/S ratio is probably low because investors think this poor revenue performance isn't going to get any better. If this is the case, then existing shareholders will probably struggle to get excited about the future direction of the share price.
If you'd like to see what analysts are forecasting going forward, you should check out our free report on DIRTT Environmental Solutions.What Are Revenue Growth Metrics Telling Us About The Low P/S?
DIRTT Environmental Solutions' P/S ratio would be typical for a company that's only expected to deliver limited growth, and importantly, perform worse than the industry.
Taking a look back first, the company's revenue growth last year wasn't something to get excited about as it posted a disappointing decline of 5.5%. Regardless, revenue has managed to lift by a handy 7.8% in aggregate from three years ago, thanks to the earlier period of growth. Accordingly, while they would have preferred to keep the run going, shareholders would be roughly satisfied with the medium-term rates of revenue growth.
Turning to the outlook, the next year should bring diminished returns, with revenue decreasing 0.6% as estimated by the only analyst watching the company. With the industry predicted to deliver 5.2% growth, that's a disappointing outcome.
In light of this, it's understandable that DIRTT Environmental Solutions' P/S would sit below the majority of other companies. However, shrinking revenues are unlikely to lead to a stable P/S over the longer term. Even just maintaining these prices could be difficult to achieve as the weak outlook is weighing down the shares.
What We Can Learn From DIRTT Environmental Solutions' P/S?
The latest share price surge wasn't enough to lift DIRTT Environmental Solutions' P/S close to the industry median. It's argued the price-to-sales ratio is an inferior measure of value within certain industries, but it can be a powerful business sentiment indicator.
It's clear to see that DIRTT Environmental Solutions maintains its low P/S on the weakness of its forecast for sliding revenue, as expected. Right now shareholders are accepting the low P/S as they concede future revenue probably won't provide any pleasant surprises. Unless these conditions improve, they will continue to form a barrier for the share price around these levels.
There are also other vital risk factors to consider before investing and we've discovered 1 warning sign for DIRTT Environmental Solutions that you should be aware of.
Of course, profitable companies with a history of great earnings growth are generally safer bets. So you may wish to see this free collection of other companies that have reasonable P/E ratios and have grown earnings strongly.
Mobile Infrastructure for Defense and Disaster
The next wave in robotics isn't humanoid. Its fully autonomous towers delivering 5G, ISR, and radar in under 30 minutes, anywhere.
Get the investor briefing before the next round of contracts
Sponsored On Behalf of CiTechNew: Manage All Your Stock Portfolios in One Place
We've created the ultimate portfolio companion for stock investors, and it's free.
• Connect an unlimited number of Portfolios and see your total in one currency
• Be alerted to new Warning Signs or Risks via email or mobile
• Track the Fair Value of your stocks
Have feedback on this article? Concerned about the content? Get in touch with us directly. Alternatively, email editorial-team (at) simplywallst.com.
This article by Simply Wall St is general in nature. We provide commentary based on historical data and analyst forecasts only using an unbiased methodology and our articles are not intended to be financial advice. It does not constitute a recommendation to buy or sell any stock, and does not take account of your objectives, or your financial situation. We aim to bring you long-term focused analysis driven by fundamental data. Note that our analysis may not factor in the latest price-sensitive company announcements or qualitative material. Simply Wall St has no position in any stocks mentioned.
About TSX:DRT
DIRTT Environmental Solutions
Operates as an interior construction company in Canada.
Undervalued with high growth potential.
Market Insights

Weekly Picks

THE KINGDOM OF BROWN GOODS: WHY MGPI IS BEING CRUSHED BY INVENTORY & PRIMED FOR RESURRECTION


Why Vertical Aerospace (NYSE: EVTL) is Worth Possibly Over 13x its Current Price


The Quiet Giant That Became AI’s Power Grid
Recently Updated Narratives

Deep Value Multi Bagger Opportunity


A case for CA$31.80 (undiluted), aka 8,616% upside from CA$0.37 (an 86 bagger!).


Unicycive Therapeutics (Nasdaq: UNCY) – Preparing for a Second Shot at Bringing a New Kidney Treatment to Market (TEST)
Popular Narratives


MicroVision will explode future revenue by 380.37% with a vision towards success


NVDA: Expanding AI Demand Will Drive Major Data Center Investments Through 2026


Crazy Undervalued 42 Baggers Silver Play (Active & Running Mine)
Trending Discussion


