Bank of Nova Scotia (TSE:BNS) shareholders have earned a 1.9% CAGR over the last five years


While it may not be enough for some shareholders, we think it is good to see the The Bank of Nova Scotia (TSE:BNS) share price up 10% in a single quarter. But if you look at the last five years the returns have not been good. You would have done a lot better buying an index fund, since the stock has dropped 17% in that half decade.
It's worthwhile assessing if the company's economics have been moving in lockstep with these underwhelming shareholder returns, or if there is some disparity between the two. So let's do just that.
View our latest analysis for Bank of Nova Scotia
While markets are a powerful pricing mechanism, share prices reflect investor sentiment, not just underlying business performance. One flawed but reasonable way to assess how sentiment around a company has changed is to compare the earnings per share (EPS) with the share price.
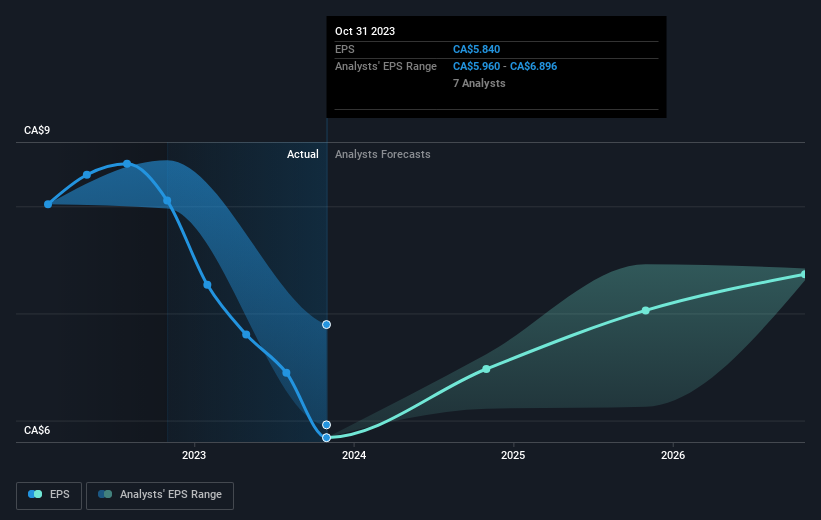
During the five years over which the share price declined, Bank of Nova Scotia's earnings per share (EPS) dropped by 3.5% each year. In this case, the EPS change is really very close to the share price drop of 4% a year. That suggests that the market sentiment around the company hasn't changed much over that time. Rather, the share price change has reflected changes in earnings per share.
You can see how EPS has changed over time in the image below (click on the chart to see the exact values).
We like that insiders have been buying shares in the last twelve months. Having said that, most people consider earnings and revenue growth trends to be a more meaningful guide to the business. This free interactive report on Bank of Nova Scotia's earnings, revenue and cash flow is a great place to start, if you want to investigate the stock further.
What About Dividends?
When looking at investment returns, it is important to consider the difference between total shareholder return (TSR) and share price return. The TSR incorporates the value of any spin-offs or discounted capital raisings, along with any dividends, based on the assumption that the dividends are reinvested. So for companies that pay a generous dividend, the TSR is often a lot higher than the share price return. In the case of Bank of Nova Scotia, it has a TSR of 9.7% for the last 5 years. That exceeds its share price return that we previously mentioned. This is largely a result of its dividend payments!
A Different Perspective
Investors in Bank of Nova Scotia had a tough year, with a total loss of 5.0% (including dividends), against a market gain of about 2.6%. Even the share prices of good stocks drop sometimes, but we want to see improvements in the fundamental metrics of a business, before getting too interested. Longer term investors wouldn't be so upset, since they would have made 1.9%, each year, over five years. If the fundamental data continues to indicate long term sustainable growth, the current sell-off could be an opportunity worth considering. If you want to research this stock further, the data on insider buying is an obvious place to start. You can click here to see who has been buying shares - and the price they paid.
There are plenty of other companies that have insiders buying up shares. You probably do not want to miss this free list of growing companies that insiders are buying.
Please note, the market returns quoted in this article reflect the market weighted average returns of stocks that currently trade on Canadian exchanges.
Valuation is complex, but we're here to simplify it.
Discover if Bank of Nova Scotia might be undervalued or overvalued with our detailed analysis, featuring fair value estimates, potential risks, dividends, insider trades, and its financial condition.
Access Free AnalysisHave feedback on this article? Concerned about the content? Get in touch with us directly. Alternatively, email editorial-team (at) simplywallst.com.
This article by Simply Wall St is general in nature. We provide commentary based on historical data and analyst forecasts only using an unbiased methodology and our articles are not intended to be financial advice. It does not constitute a recommendation to buy or sell any stock, and does not take account of your objectives, or your financial situation. We aim to bring you long-term focused analysis driven by fundamental data. Note that our analysis may not factor in the latest price-sensitive company announcements or qualitative material. Simply Wall St has no position in any stocks mentioned.
About TSX:BNS
Bank of Nova Scotia
Provides various banking products and services in Canada, the United States, Mexico, Peru, Chile, Colombia, the Caribbean and Central America, and internationally.
Excellent balance sheet established dividend payer.

