- Brazil
- /
- Specialty Stores
- /
- BOVESPA:CEAB3
Are C&A Modas S.A.'s (BVMF:CEAB3) Mixed Financials Driving The Negative Sentiment?


It is hard to get excited after looking at C&A Modas' (BVMF:CEAB3) recent performance, when its stock has declined 23% over the past three months. We, however decided to study the company's financials to determine if they have got anything to do with the price decline. Stock prices are usually driven by a company’s financial performance over the long term, and therefore we decided to pay more attention to the company's financial performance. In this article, we decided to focus on C&A Modas' ROE.
Return on Equity or ROE is a test of how effectively a company is growing its value and managing investors’ money. In short, ROE shows the profit each dollar generates with respect to its shareholder investments.
Check out our latest analysis for C&A Modas
How Is ROE Calculated?
ROE can be calculated by using the formula:
Return on Equity = Net Profit (from continuing operations) ÷ Shareholders' Equity
So, based on the above formula, the ROE for C&A Modas is:
12% = R$366m ÷ R$3.2b (Based on the trailing twelve months to September 2024).
The 'return' is the income the business earned over the last year. Another way to think of that is that for every R$1 worth of equity, the company was able to earn R$0.12 in profit.
What Is The Relationship Between ROE And Earnings Growth?
So far, we've learned that ROE is a measure of a company's profitability. Based on how much of its profits the company chooses to reinvest or "retain", we are then able to evaluate a company's future ability to generate profits. Assuming all else is equal, companies that have both a higher return on equity and higher profit retention are usually the ones that have a higher growth rate when compared to companies that don't have the same features.
C&A Modas' Earnings Growth And 12% ROE
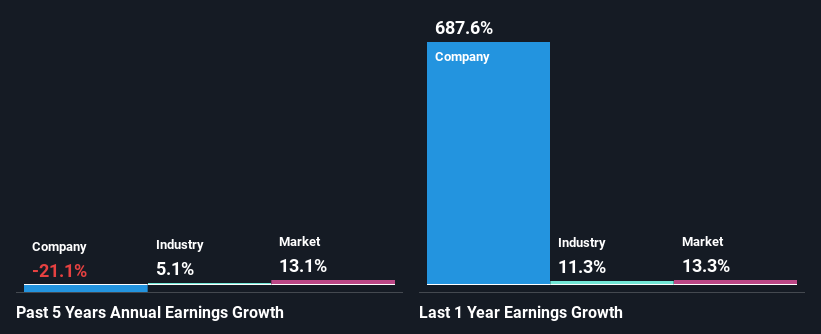
As you can see, C&A Modas' ROE looks pretty weak. A comparison with the industry shows that the company's ROE is pretty similar to the average industry ROE of 12%. Therefore, it might not be wrong to say that the five year net income decline of 21% seen by C&A Modas was possibly a result of the disappointing ROE.
So, as a next step, we compared C&A Modas' performance against the industry and were disappointed to discover that while the company has been shrinking its earnings, the industry has been growing its earnings at a rate of 5.1% over the last few years.
The basis for attaching value to a company is, to a great extent, tied to its earnings growth. What investors need to determine next is if the expected earnings growth, or the lack of it, is already built into the share price. By doing so, they will have an idea if the stock is headed into clear blue waters or if swampy waters await. One good indicator of expected earnings growth is the P/E ratio which determines the price the market is willing to pay for a stock based on its earnings prospects. So, you may want to check if C&A Modas is trading on a high P/E or a low P/E, relative to its industry.
Is C&A Modas Efficiently Re-investing Its Profits?
Conclusion
In total, we're a bit ambivalent about C&A Modas' performance. While the company does have a high rate of reinvestment, the low ROE means that all that reinvestment is not reaping any benefit to its investors, and moreover, its having a negative impact on the earnings growth. That being so, the latest industry analyst forecasts show that the analysts are expecting to see a huge improvement in the company's earnings growth rate. To know more about the company's future earnings growth forecasts take a look at this free report on analyst forecasts for the company to find out more.
New: AI Stock Screener & Alerts
Our new AI Stock Screener scans the market every day to uncover opportunities.
• Dividend Powerhouses (3%+ Yield)
• Undervalued Small Caps with Insider Buying
• High growth Tech and AI Companies
Or build your own from over 50 metrics.
Have feedback on this article? Concerned about the content? Get in touch with us directly. Alternatively, email editorial-team (at) simplywallst.com.
This article by Simply Wall St is general in nature. We provide commentary based on historical data and analyst forecasts only using an unbiased methodology and our articles are not intended to be financial advice. It does not constitute a recommendation to buy or sell any stock, and does not take account of your objectives, or your financial situation. We aim to bring you long-term focused analysis driven by fundamental data. Note that our analysis may not factor in the latest price-sensitive company announcements or qualitative material. Simply Wall St has no position in any stocks mentioned.
About BOVESPA:CEAB3
Good value with proven track record.
Market Insights

Community Narratives
