- Brazil
- /
- Oil and Gas
- /
- BOVESPA:CSAN3
Cosan (BVMF:CSAN3) investors are sitting on a loss of 36% if they invested three years ago


As an investor its worth striving to ensure your overall portfolio beats the market average. But in any portfolio, there are likely to be some stocks that fall short of that benchmark. Unfortunately, that's been the case for longer term Cosan S.A. (BVMF:CSAN3) shareholders, since the share price is down 42% in the last three years, falling well short of the market decline of around 12%.
Since shareholders are down over the longer term, lets look at the underlying fundamentals over the that time and see if they've been consistent with returns.
View our latest analysis for Cosan
To paraphrase Benjamin Graham: Over the short term the market is a voting machine, but over the long term it's a weighing machine. One imperfect but simple way to consider how the market perception of a company has shifted is to compare the change in the earnings per share (EPS) with the share price movement.
During five years of share price growth, Cosan moved from a loss to profitability. We would usually expect to see the share price rise as a result. So it's worth looking at other metrics to try to understand the share price move.
We note that, in three years, revenue has actually grown at a 22% annual rate, so that doesn't seem to be a reason to sell shares. It's probably worth investigating Cosan further; while we may be missing something on this analysis, there might also be an opportunity.
The company's revenue and earnings (over time) are depicted in the image below (click to see the exact numbers).
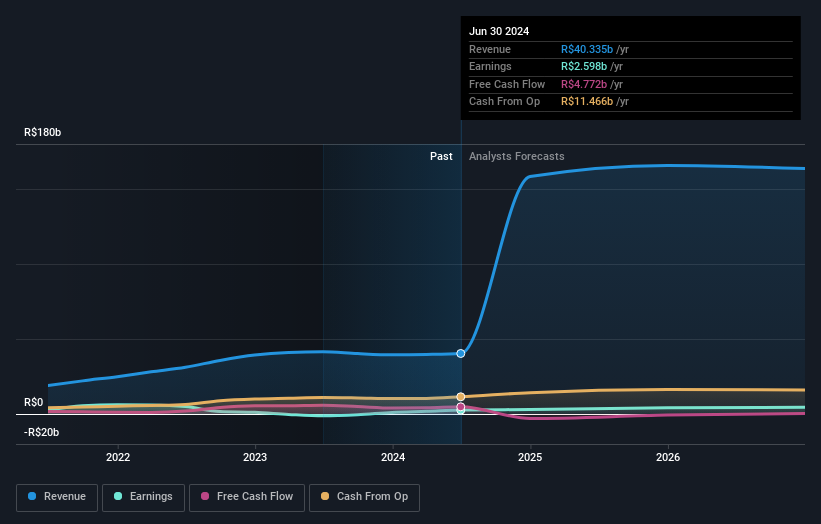
We know that Cosan has improved its bottom line lately, but what does the future have in store? So it makes a lot of sense to check out what analysts think Cosan will earn in the future (free profit forecasts).
What About Dividends?
When looking at investment returns, it is important to consider the difference between total shareholder return (TSR) and share price return. The TSR is a return calculation that accounts for the value of cash dividends (assuming that any dividend received was reinvested) and the calculated value of any discounted capital raisings and spin-offs. So for companies that pay a generous dividend, the TSR is often a lot higher than the share price return. In the case of Cosan, it has a TSR of -36% for the last 3 years. That exceeds its share price return that we previously mentioned. This is largely a result of its dividend payments!
A Different Perspective
Cosan shareholders are down 15% for the year (even including dividends), but the market itself is up 17%. However, keep in mind that even the best stocks will sometimes underperform the market over a twelve month period. Longer term investors wouldn't be so upset, since they would have made 1.5%, each year, over five years. It could be that the recent sell-off is an opportunity, so it may be worth checking the fundamental data for signs of a long term growth trend. While it is well worth considering the different impacts that market conditions can have on the share price, there are other factors that are even more important. For example, we've discovered 2 warning signs for Cosan (1 can't be ignored!) that you should be aware of before investing here.
But note: Cosan may not be the best stock to buy. So take a peek at this free list of interesting companies with past earnings growth (and further growth forecast).
Please note, the market returns quoted in this article reflect the market weighted average returns of stocks that currently trade on Brazilian exchanges.
New: AI Stock Screener & Alerts
Our new AI Stock Screener scans the market every day to uncover opportunities.
• Dividend Powerhouses (3%+ Yield)
• Undervalued Small Caps with Insider Buying
• High growth Tech and AI Companies
Or build your own from over 50 metrics.
Have feedback on this article? Concerned about the content? Get in touch with us directly. Alternatively, email editorial-team (at) simplywallst.com.
This article by Simply Wall St is general in nature. We provide commentary based on historical data and analyst forecasts only using an unbiased methodology and our articles are not intended to be financial advice. It does not constitute a recommendation to buy or sell any stock, and does not take account of your objectives, or your financial situation. We aim to bring you long-term focused analysis driven by fundamental data. Note that our analysis may not factor in the latest price-sensitive company announcements or qualitative material. Simply Wall St has no position in any stocks mentioned.
About BOVESPA:CSAN3
Undervalued with high growth potential.
Similar Companies
Market Insights

Community Narratives

