Kepler Weber Swells 11% This Week, Taking Five-Year Gains To 624%


Kepler Weber S.A. (BVMF:KEPL3) shareholders might be concerned after seeing the share price drop 11% in the last quarter. But over five years returns have been remarkably great. In fact, during that period, the share price climbed 393%. Impressive! Arguably, the recent fall is to be expected after such a strong rise. The most important thing for savvy investors to consider is whether the underlying business can justify the share price gain.
Since the stock has added R$199m to its market cap in the past week alone, let's see if underlying performance has been driving long-term returns.
Check out our latest analysis for Kepler Weber
To quote Buffett, 'Ships will sail around the world but the Flat Earth Society will flourish. There will continue to be wide discrepancies between price and value in the marketplace...' By comparing earnings per share (EPS) and share price changes over time, we can get a feel for how investor attitudes to a company have morphed over time.
During the last half decade, Kepler Weber became profitable. Sometimes, the start of profitability is a major inflection point that can signal fast earnings growth to come, which in turn justifies very strong share price gains. Given that the company made a profit three years ago, but not five years ago, it is worth looking at the share price returns over the last three years, too. We can see that the Kepler Weber share price is up 122% in the last three years. In the same period, EPS is up 91% per year. This EPS growth is higher than the 30% average annual increase in the share price over the same three years. So you might conclude the market is a little more cautious about the stock, these days. This cautious sentiment is reflected in its (fairly low) P/E ratio of 5.65.
You can see how EPS has changed over time in the image below (click on the chart to see the exact values).
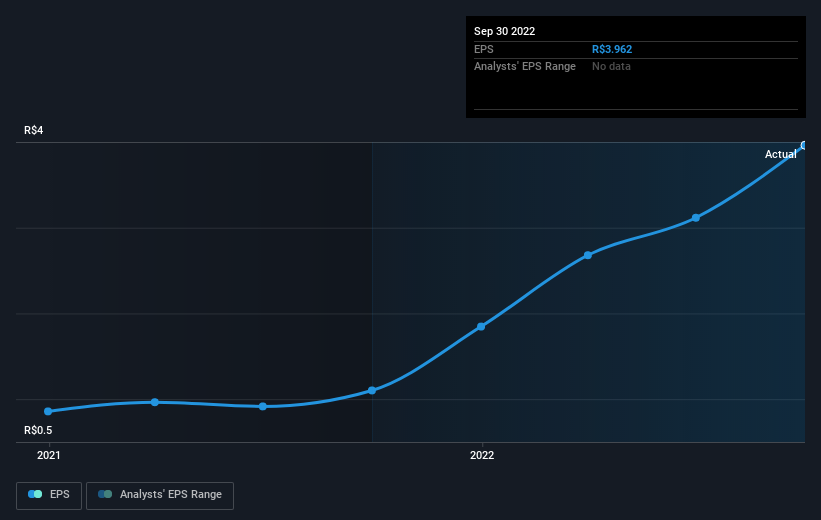
We know that Kepler Weber has improved its bottom line over the last three years, but what does the future have in store? You can see how its balance sheet has strengthened (or weakened) over time in this free interactive graphic.
What About Dividends?
As well as measuring the share price return, investors should also consider the total shareholder return (TSR). The TSR is a return calculation that accounts for the value of cash dividends (assuming that any dividend received was reinvested) and the calculated value of any discounted capital raisings and spin-offs. So for companies that pay a generous dividend, the TSR is often a lot higher than the share price return. We note that for Kepler Weber the TSR over the last 5 years was 624%, which is better than the share price return mentioned above. This is largely a result of its dividend payments!
A Different Perspective
We're pleased to report that Kepler Weber shareholders have received a total shareholder return of 109% over one year. And that does include the dividend. That gain is better than the annual TSR over five years, which is 49%. Therefore it seems like sentiment around the company has been positive lately. Someone with an optimistic perspective could view the recent improvement in TSR as indicating that the business itself is getting better with time. It's always interesting to track share price performance over the longer term. But to understand Kepler Weber better, we need to consider many other factors. Consider risks, for instance. Every company has them, and we've spotted 1 warning sign for Kepler Weber you should know about.
For those who like to find winning investments this free list of growing companies with recent insider purchasing, could be just the ticket.
Please note, the market returns quoted in this article reflect the market weighted average returns of stocks that currently trade on BR exchanges.
Valuation is complex, but we're here to simplify it.
Discover if Kepler Weber might be undervalued or overvalued with our detailed analysis, featuring fair value estimates, potential risks, dividends, insider trades, and its financial condition.
Access Free AnalysisHave feedback on this article? Concerned about the content? Get in touch with us directly. Alternatively, email editorial-team (at) simplywallst.com.
This article by Simply Wall St is general in nature. We provide commentary based on historical data and analyst forecasts only using an unbiased methodology and our articles are not intended to be financial advice. It does not constitute a recommendation to buy or sell any stock, and does not take account of your objectives, or your financial situation. We aim to bring you long-term focused analysis driven by fundamental data. Note that our analysis may not factor in the latest price-sensitive company announcements or qualitative material. Simply Wall St has no position in any stocks mentioned.
About BOVESPA:KEPL3
Kepler Weber
Provides storage equipment and post-harvest grain solutions in Brazil, Central and South America, Africa, and Asia.
Undervalued with excellent balance sheet.
Similar Companies
Market Insights

Community Narratives

